Introduction
List Reports are among the most widely used SAP Fiori application patterns for displaying and managing business data in a structured, tabular format. Built on the SAP Fiori Elements framework, they deliver a consistent and intuitive user experience while dramatically reducing the need for custom UI development.
In SAP S/4HANA Public Cloud, the SAP RAP (RESTful ABAP Programming Model) empowers developers to build enterprise-grade applications using CDS views, service definitions, and service bindings. With just a handful of development artifacts, you can generate a fully functional List Report that supports standard features such as filtering, sorting, free-text search, column personalization, variant management, and seamless navigation.
In this tutorial, you will learn how to build a basic List Report from scratch. We will walk through creating the required CDS data model, defining the business object, exposing it as an OData service, and previewing a SAP Fiori Elements List Report application.
By the end of this guide, you will have a working List Report running in your SAP S/4HANA Public Cloud system, along with a solid foundation for developing more advanced RAP applications.
Approaches to Creating a List Report
There are two common approaches to creating a List Report in SAP RAP:
-
Using CDS Views Only — The data retrieval logic is defined entirely within CDS views. This is the recommended approach for most standard scenarios, as it requires less custom code and fully leverages SAP's optimized framework.
-
Using an ABAP Class as a Query Provider — A custom ABAP class implements the query logic, acting as the data provider. This approach is suited for scenarios where business logic is too complex to express using CDS alone.
In this tutorial, we will follow the CDS-based approach.
Step 1: Create a Development Package
The first step is to create a development package that will serve as the container for all objects required by this application — including CDS views, behavior definitions, service definitions, and other RAP artifacts.
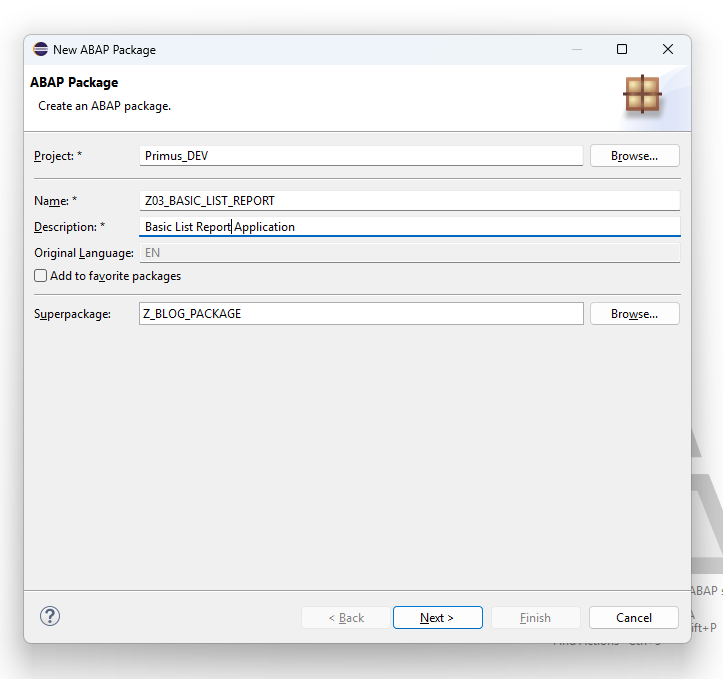
Create a new package in your development system.
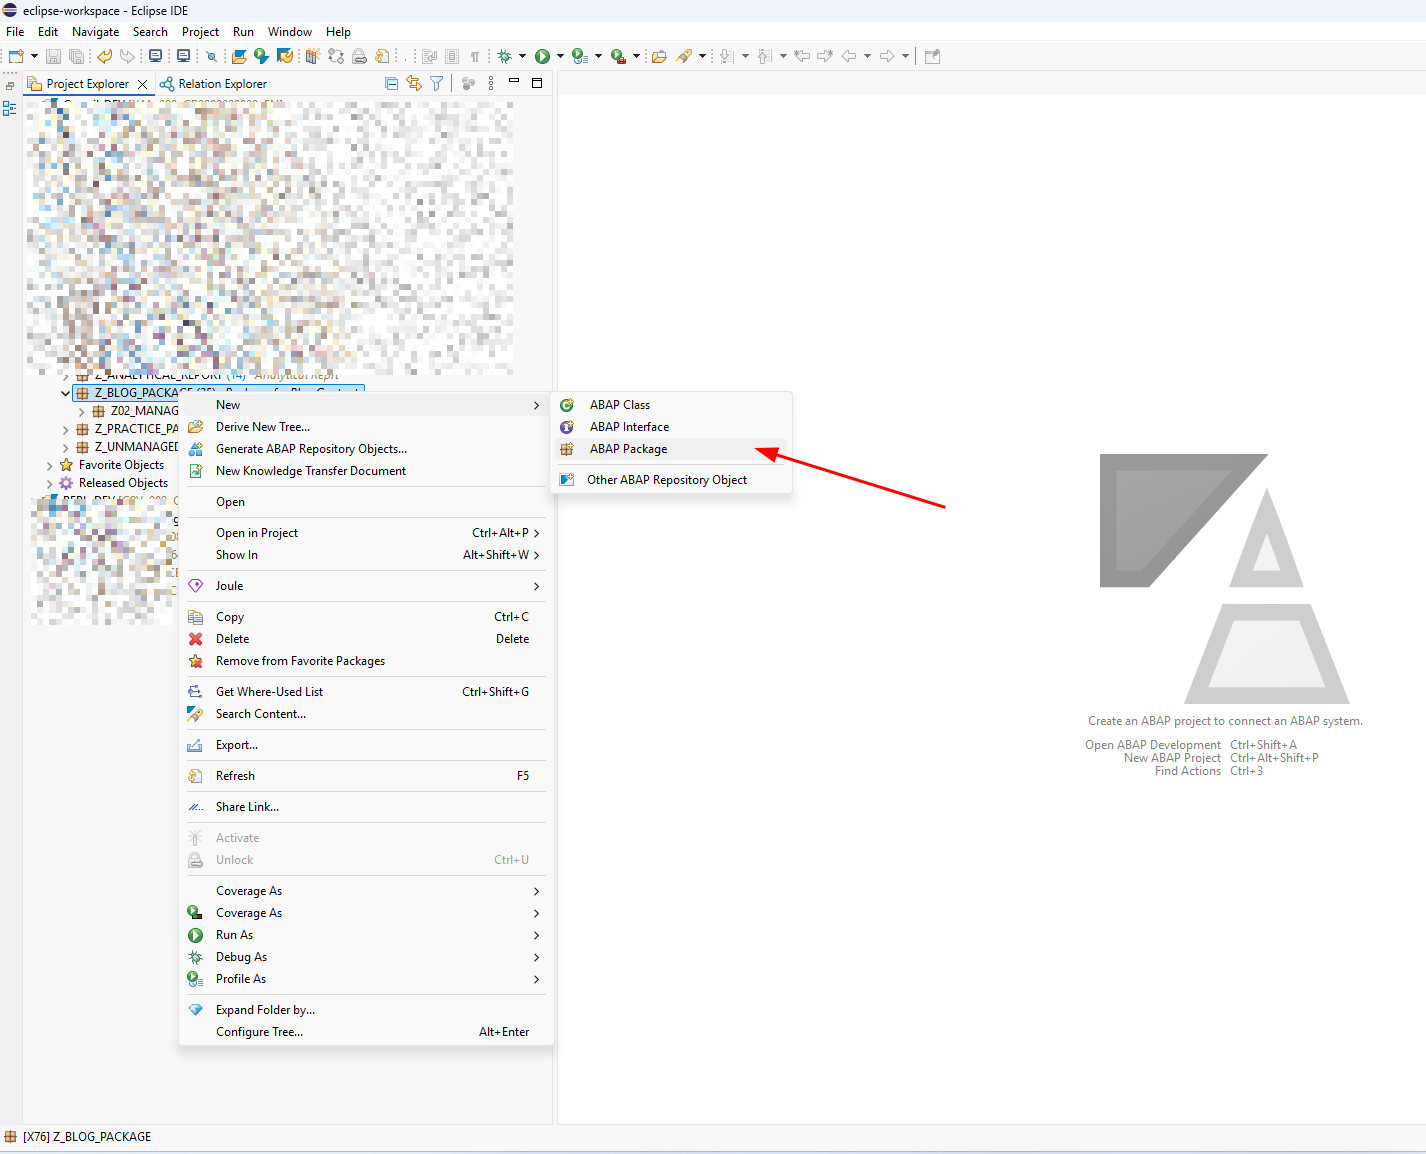
Enter the package details, then save and activate the package.
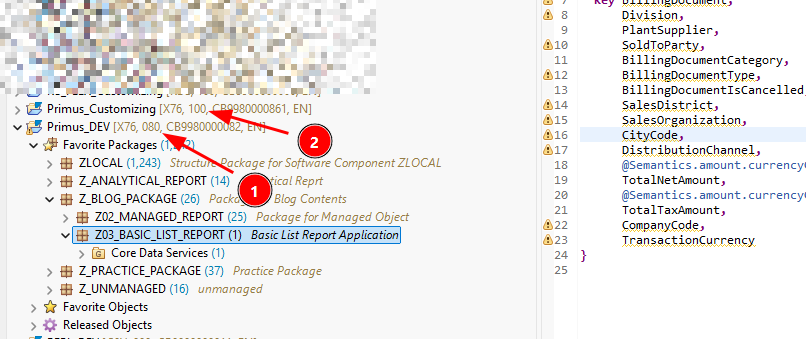
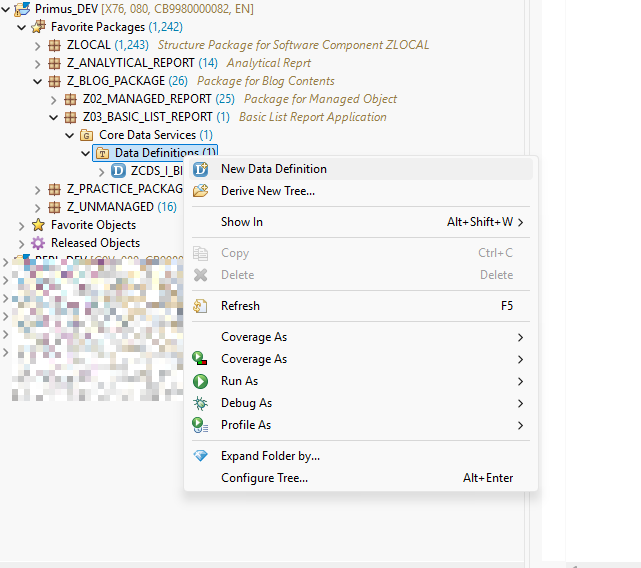
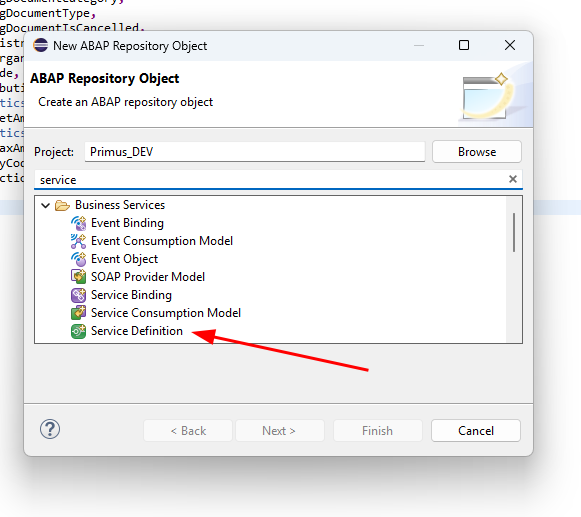
Right-click on your package and select Other ABAP Repository Object.
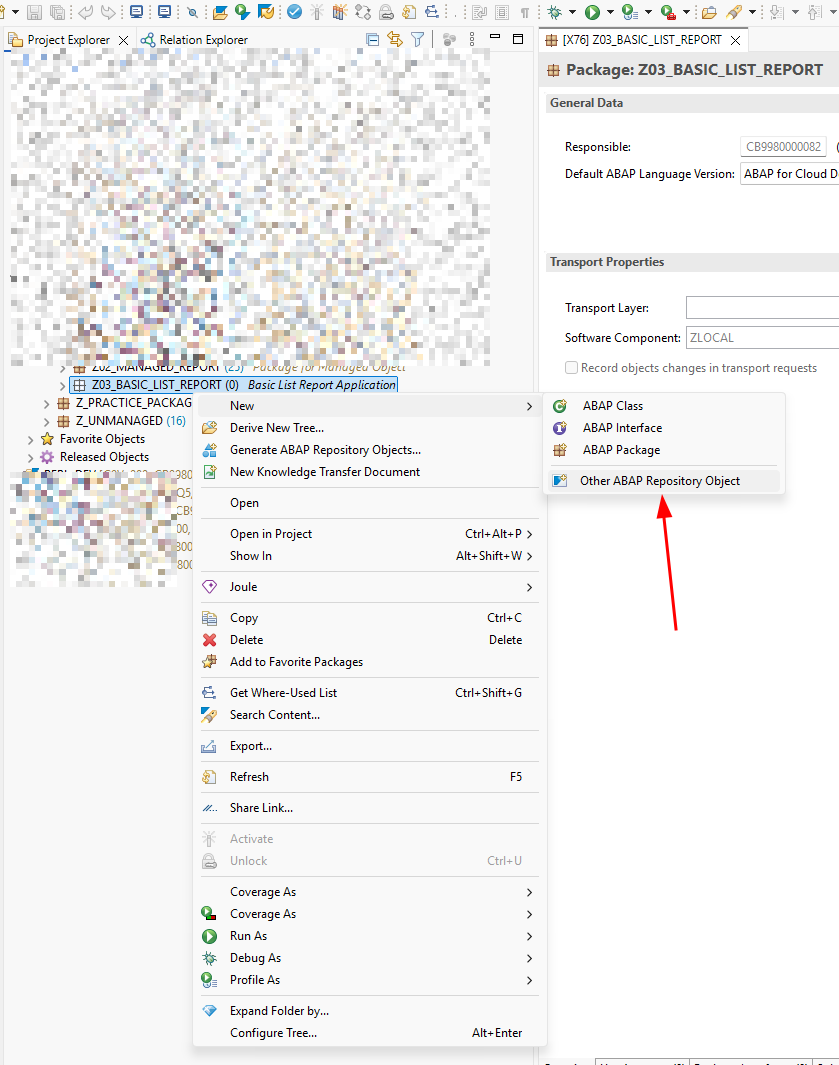
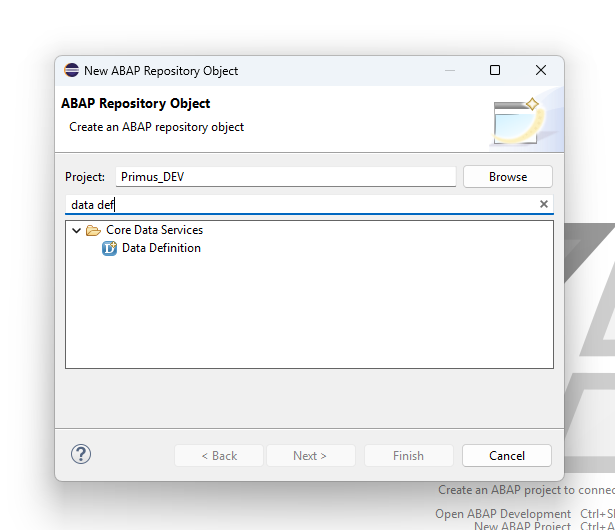
Search for Data Definition — this is the object type used to create a CDS view.
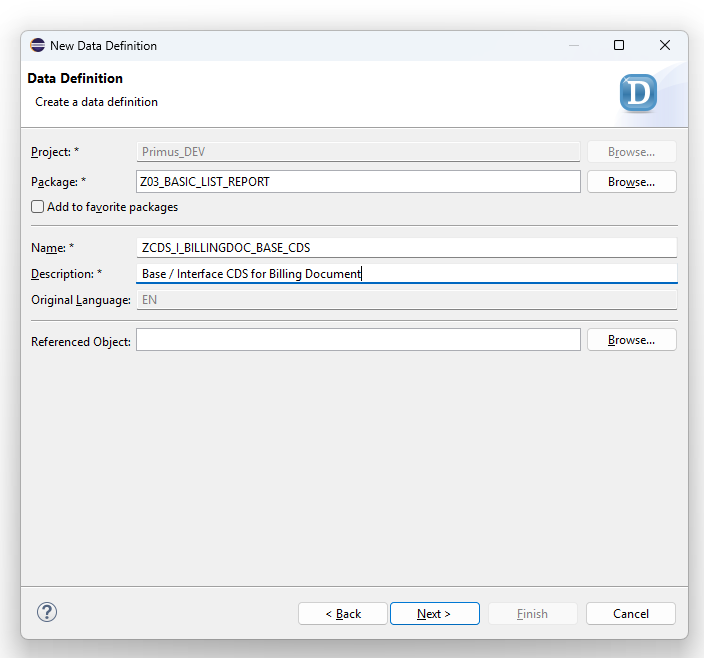
Step 2: Create the Base (Interface) CDS View
Begin by creating the Base or Interface CDS view, which serves as the foundation of your data model.
From the available CDS templates, select defineRootViewEntity.
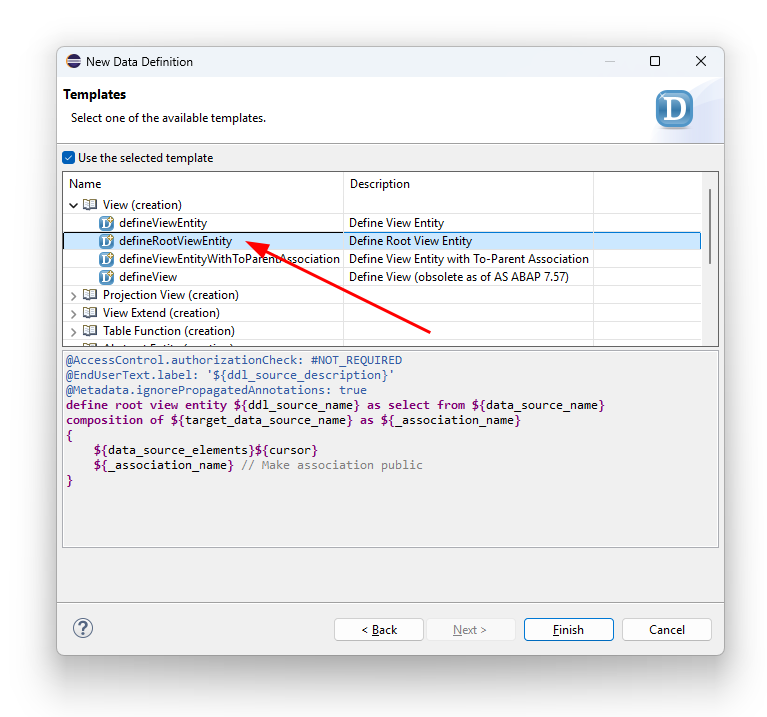
The template generates boilerplate code. Remove any unnecessary scaffolding to keep the view clean and focused.
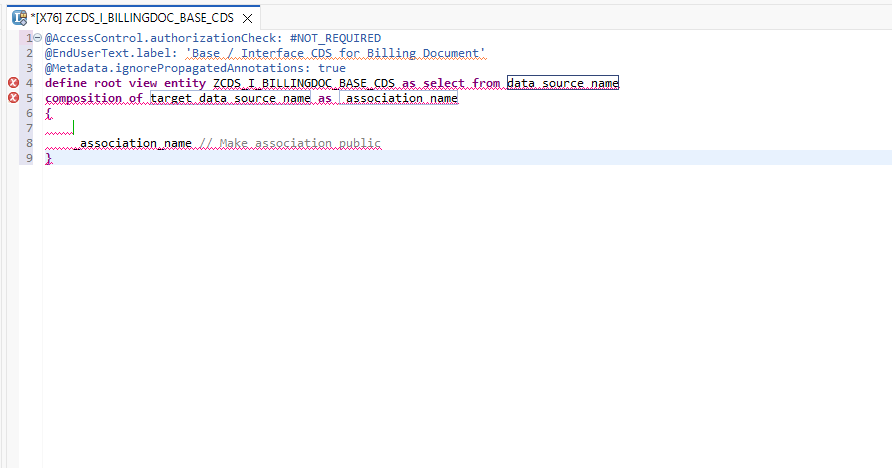
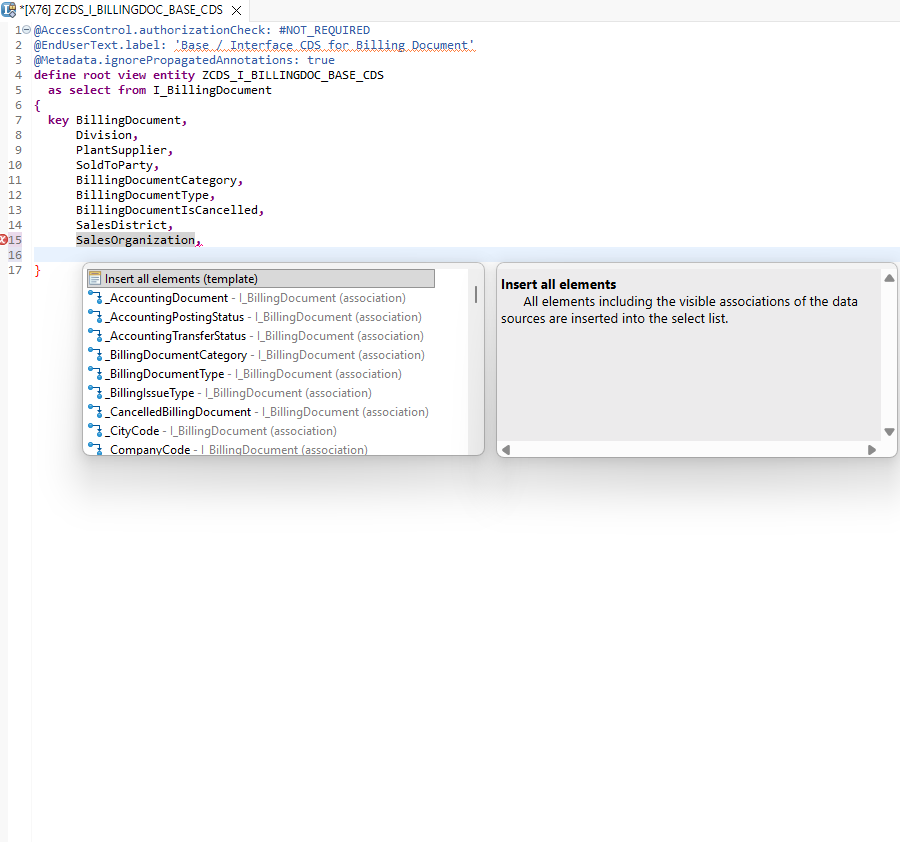
In the SELECT statement, use I_BillingDocument as the data source.
Tip: Press
Ctrl + Spaceto activate auto-suggestions.
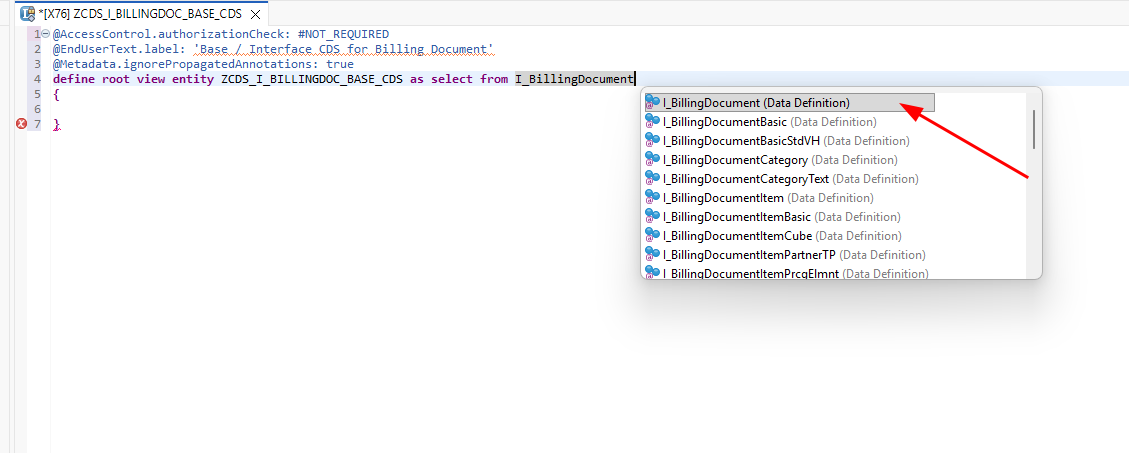
Add all required fields. Use the auto-suggestion feature and select Insert all elements (template) to automatically pull all fields from I_BillingDocument.
You will notice an error related to TotalNetAmount. This is a currency amount field, and SAP requires that all amount fields be linked to a corresponding currency field via annotations.
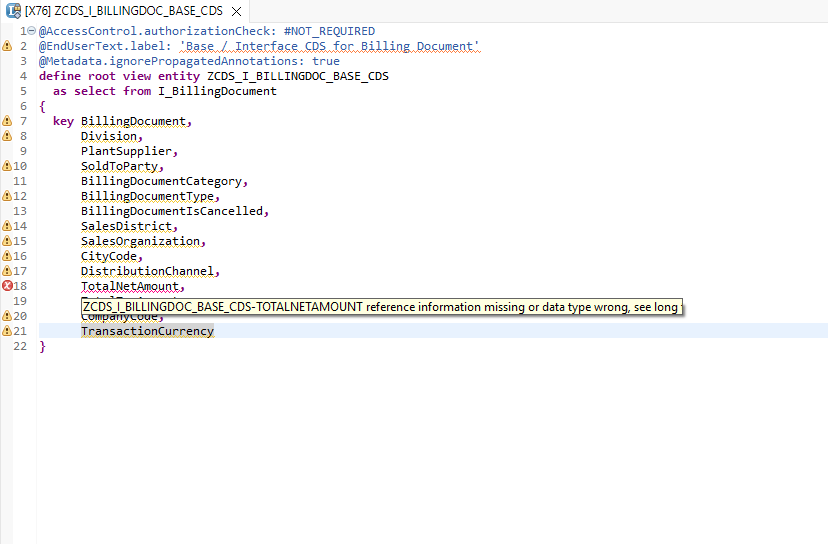
Link both TotalNetAmount and TotalTaxAmount to TransactionCurrency using the appropriate semantic annotation.
Note: A similar error will occur for quantity fields. In those cases, use
@Semantics.quantity.unitOfMeasure: ''and reference the corresponding unit of measure field.
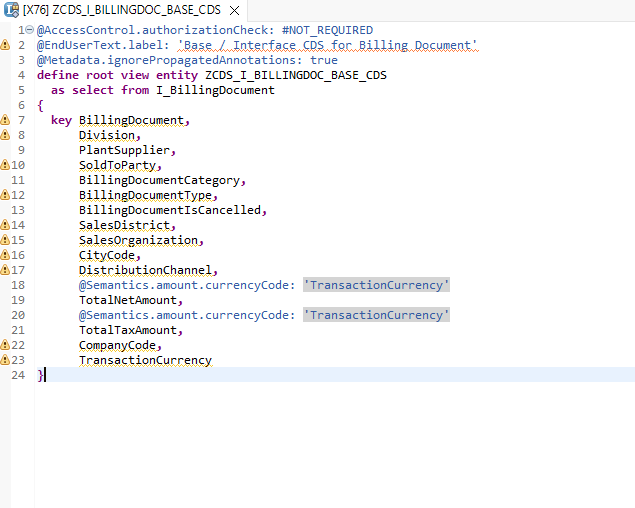
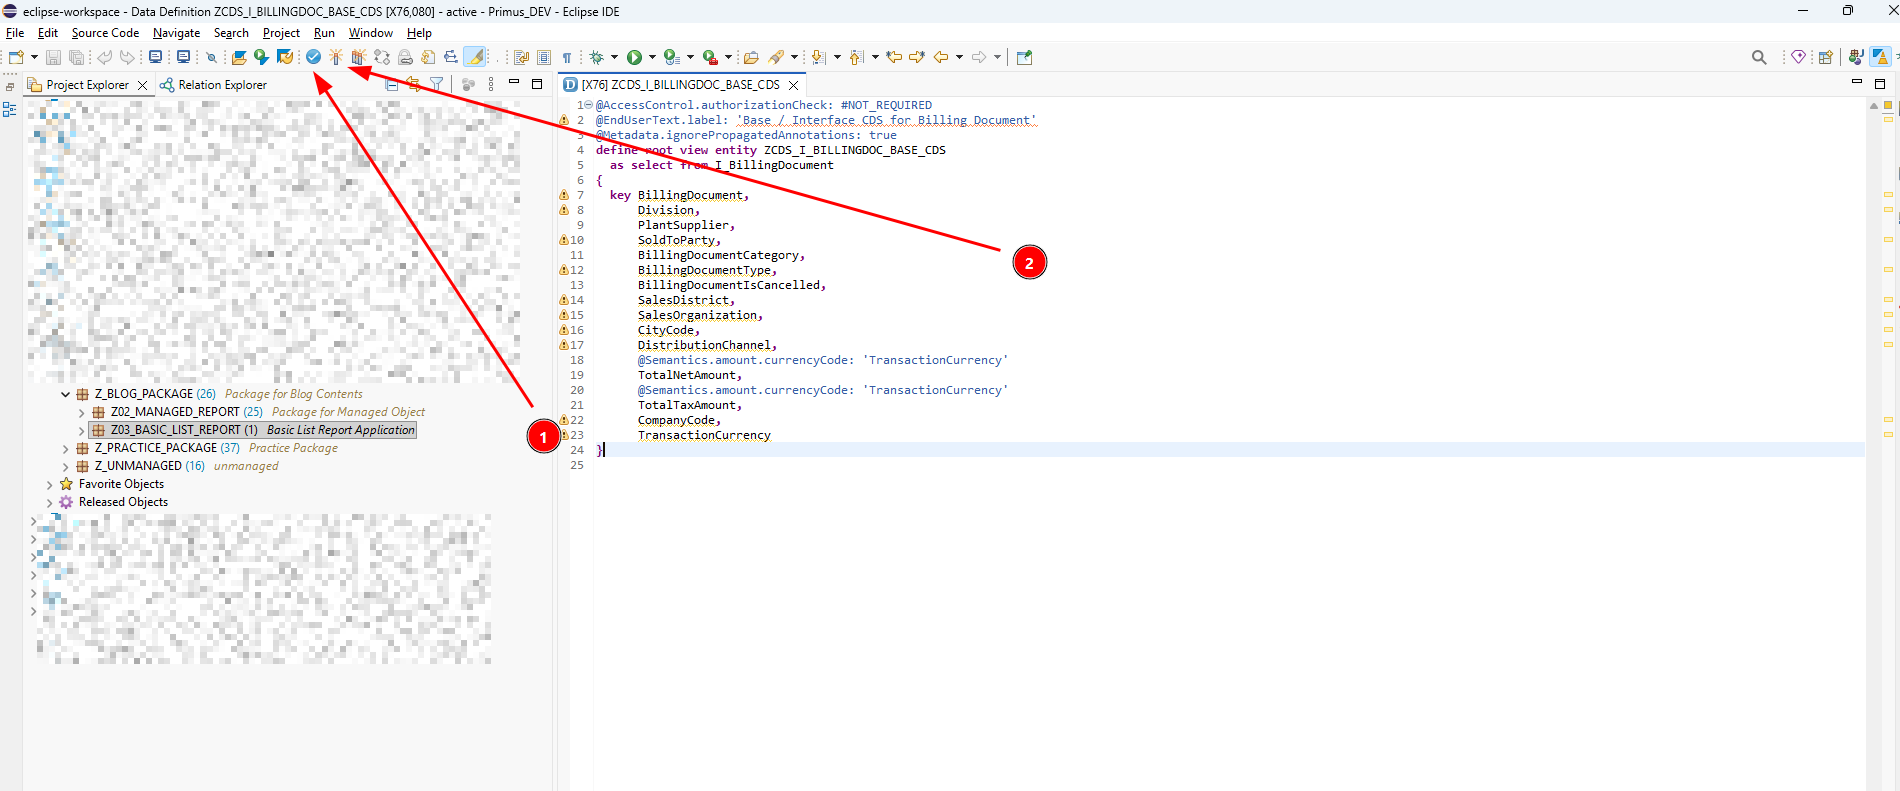
Perform a syntax check, then activate the CDS view.
Step 3: Verify Data in the Correct Client
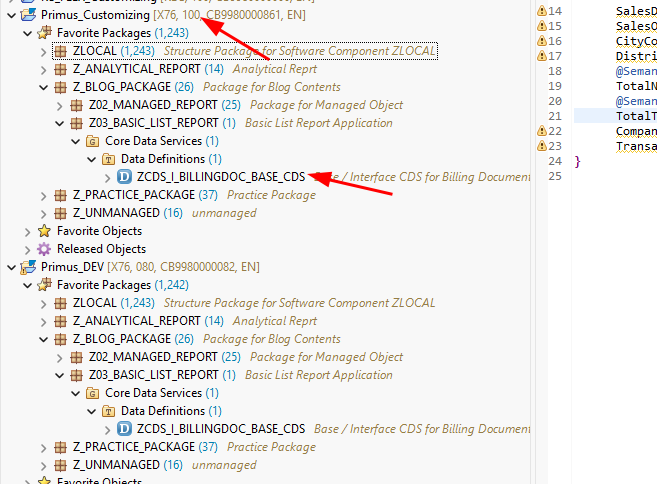
Development work takes place in Client 80 (the development system). Business data, however, resides in Client 100 (the production-equivalent client in Public Cloud).
Open the same CDS view in Client 100 to verify the data.
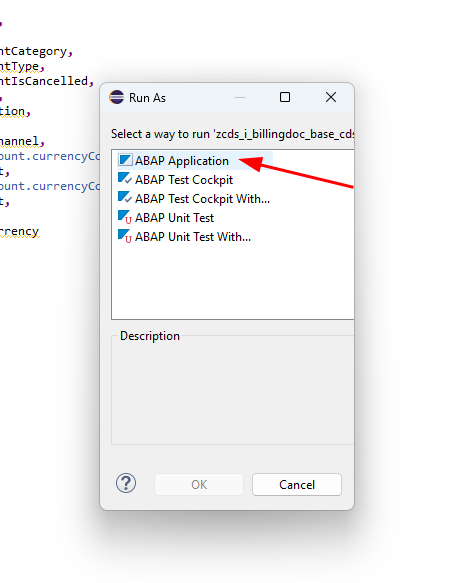
Execute the CDS view in Client 100 to preview the results.
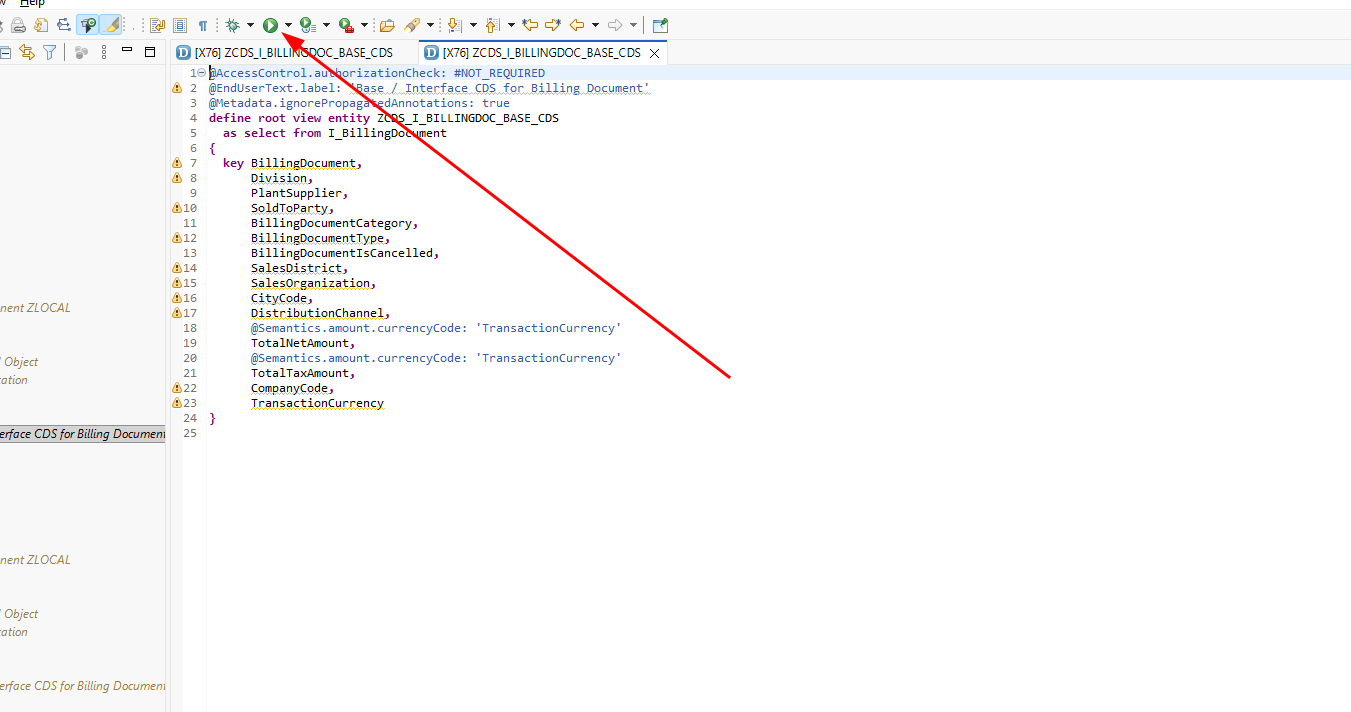
Select ABAP Application, or press F8 to run the preview.
If an error appears at this point, it is typically caused by a missing API contract on the standard CDS view being consumed. To resolve this, add an API State.
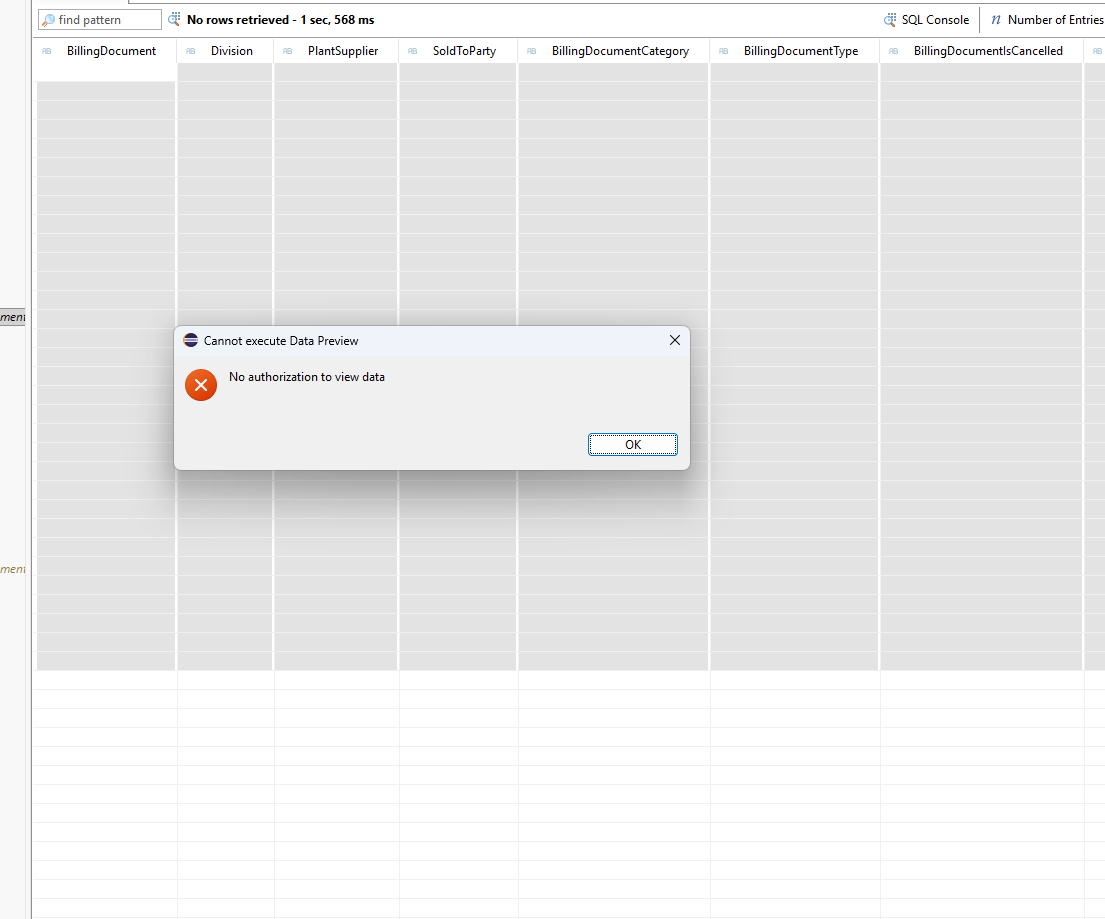
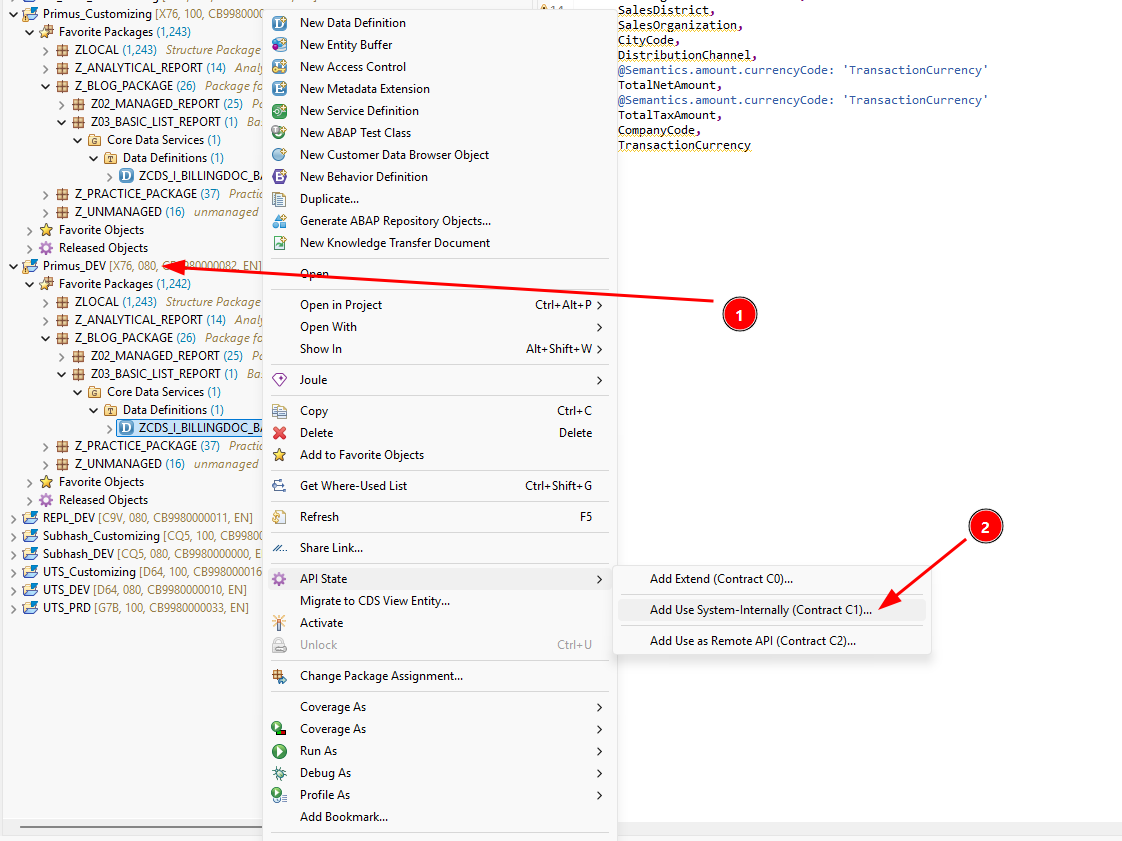
Right-click the CDS view you created in Client 80, then navigate to API State → Add Use System-Internally (Contract C1).
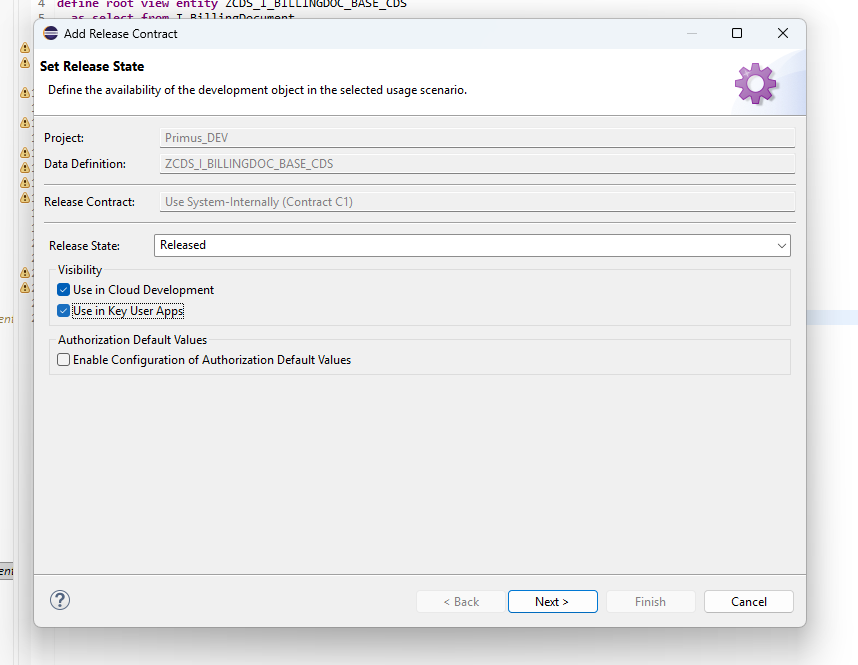
Check both Use in Cloud Development and Use in Key User Apps, then proceed to the next step.
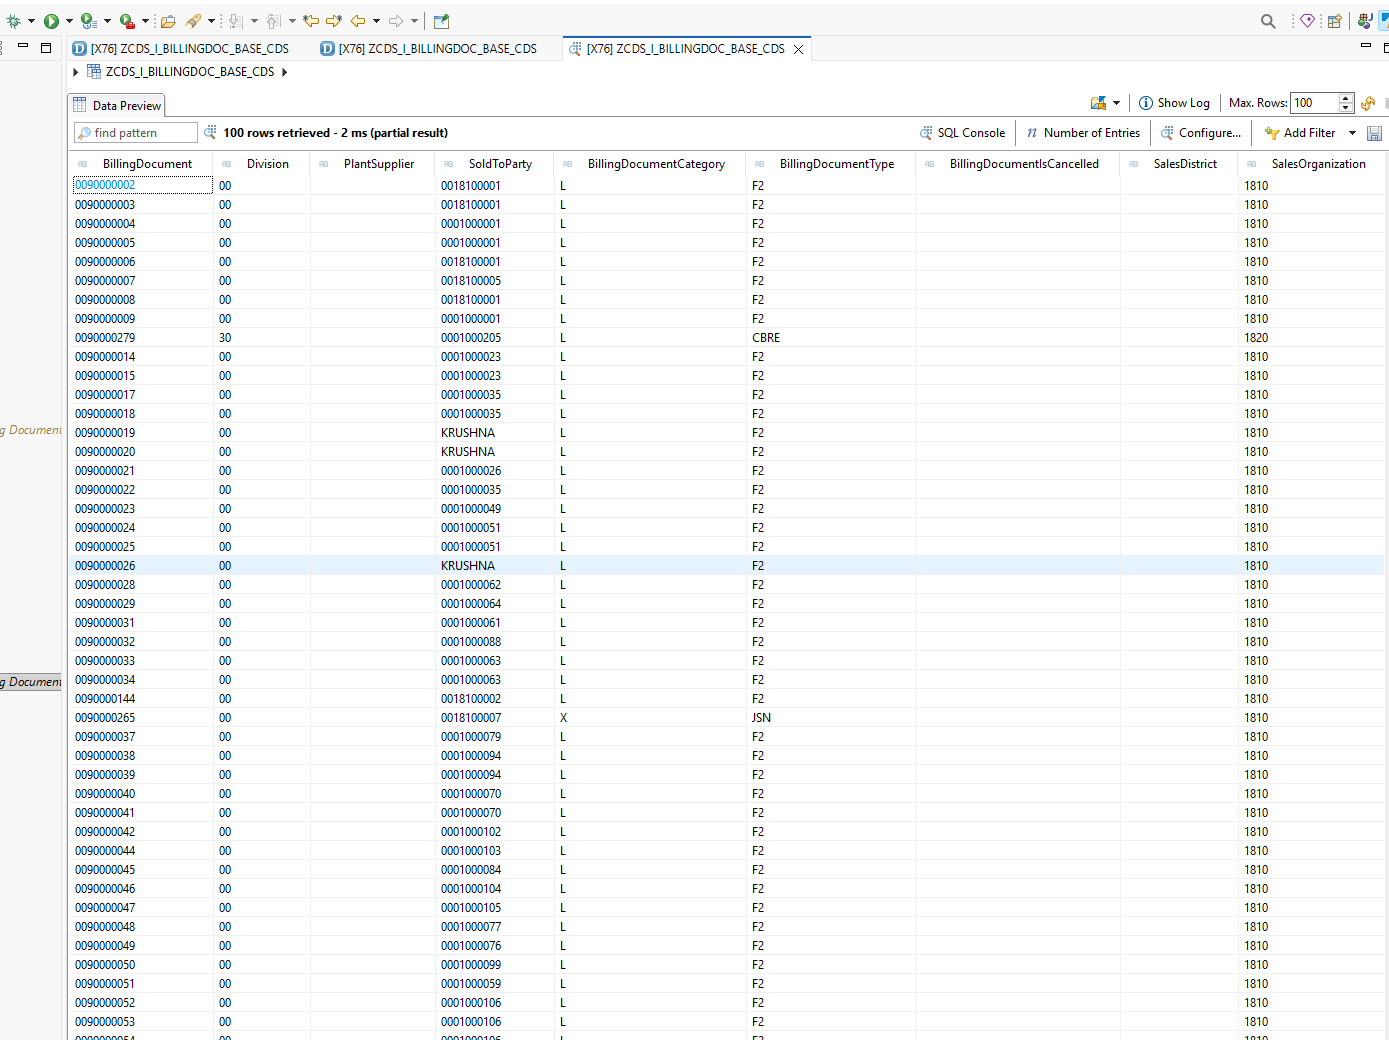
After applying the API state, re-execute the CDS view. The data should now be visible.
Step 4: Create the Projection (Consumption) View
With the base CDS view in place, the next step is to create a Projection View, also known as a Consumption View. This layer adds UI-specific metadata and restricts the fields exposed to the frontend.
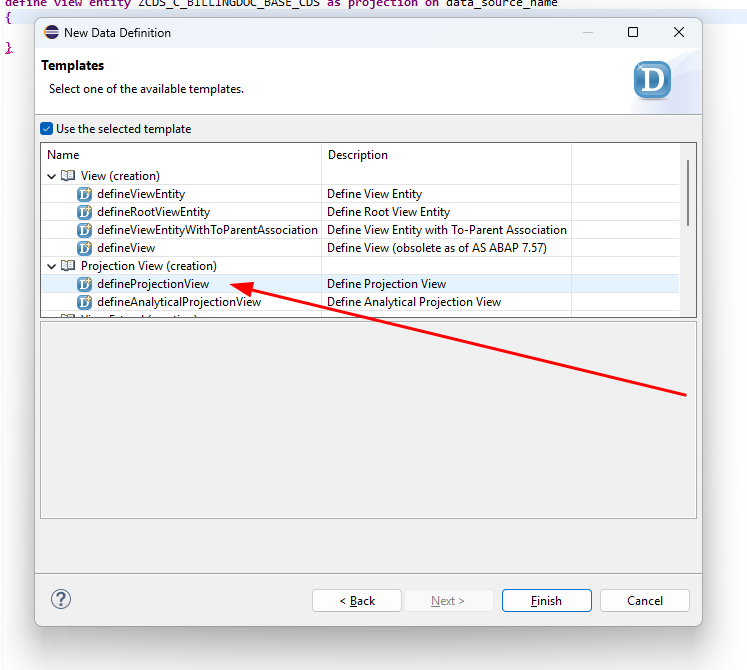
This time, select the defineProjectionView template.
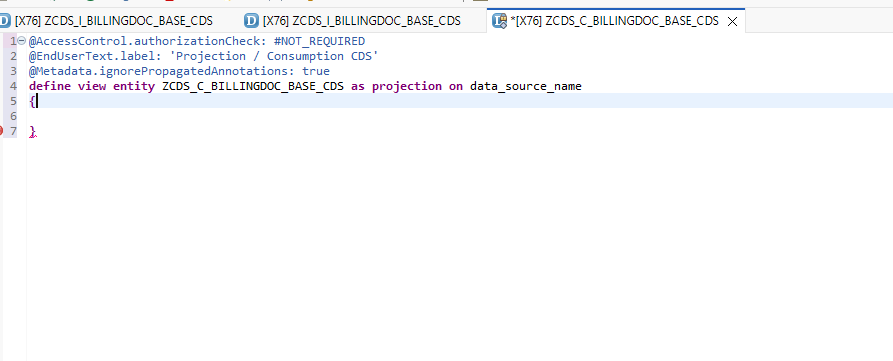
Modify the generated boilerplate to suit your requirements.
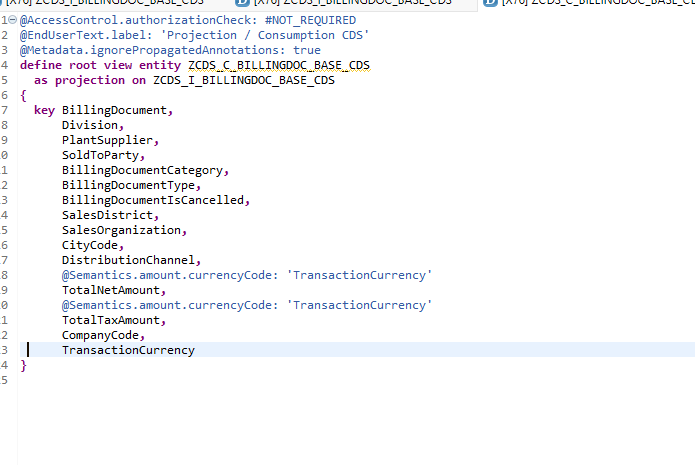
In the PROJECTION ON clause, reference your previously created base CDS view. Add the root keyword after define and before view entity, since the base view is defined as a root view entity. Then insert all elements from the base CDS view.
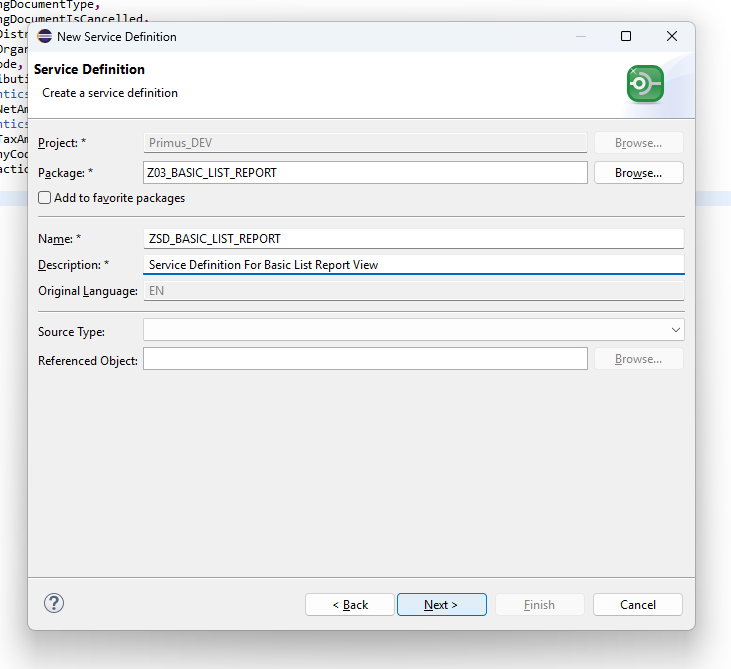
Step 5: Create the Service Definition
The Service Definition exposes your projection view as an OData service entity.
Enter the required name and description.
The generated boilerplate will look like this.
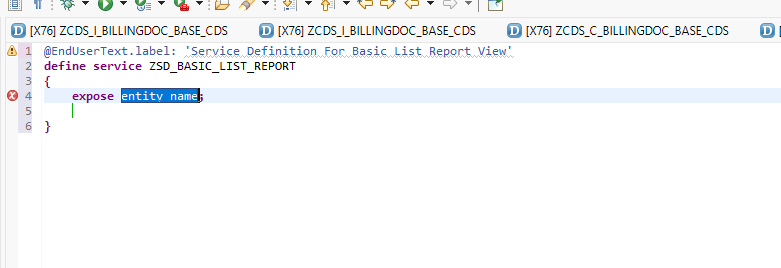
Expose your Projection View with a meaningful alias using the as keyword. In this example, the alias is set to BillingList.
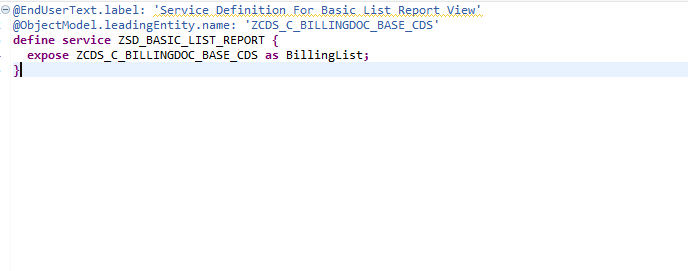
Activate the Service Definition once complete.
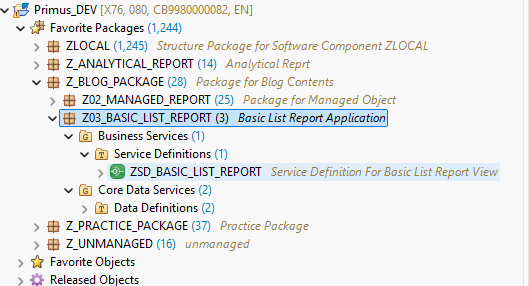
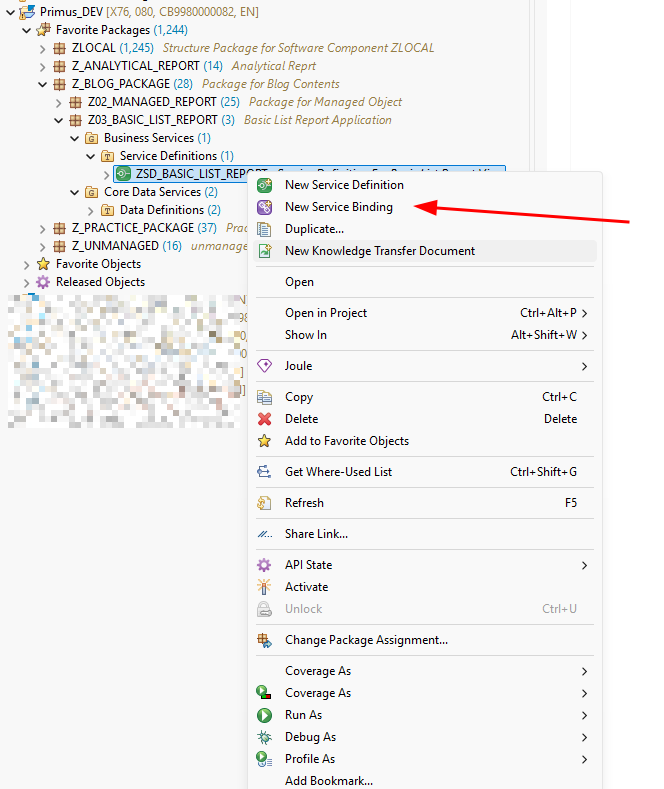
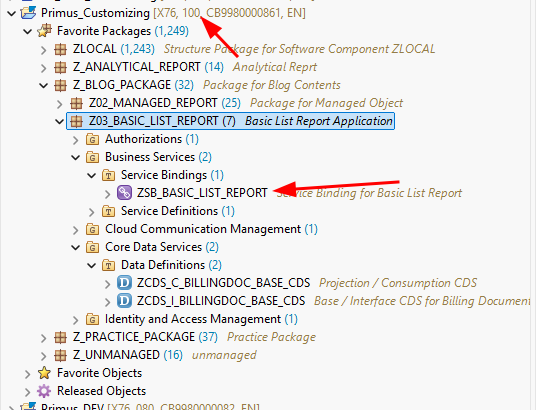
Step 6: Create the Service Binding
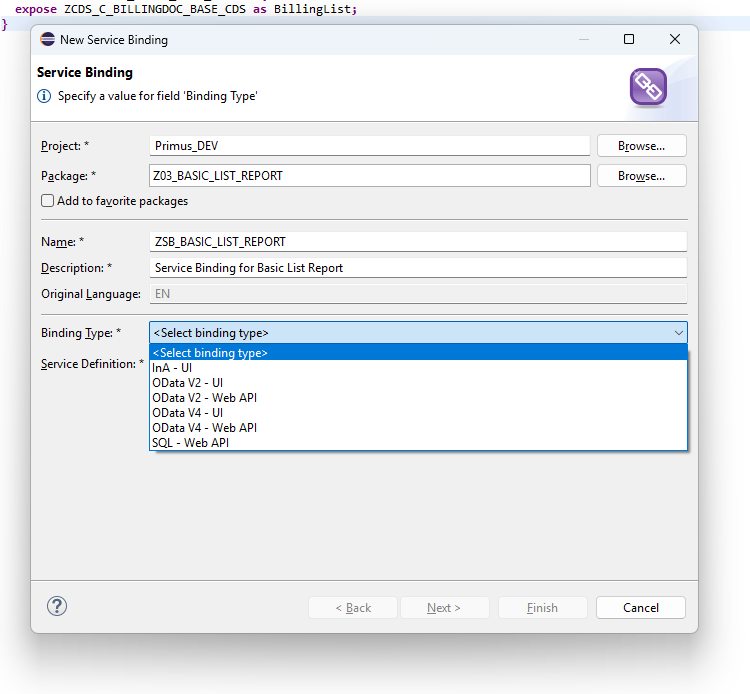
Right-click on the Service Definition and select New Service Binding.
Enter a name and description. Under Binding Type, select either OData V2 – UI or OData V4 – UI. Both are fully supported; this tutorial uses OData V4 – UI, as it is the more modern standard and includes performance optimizations and expanded feature support.
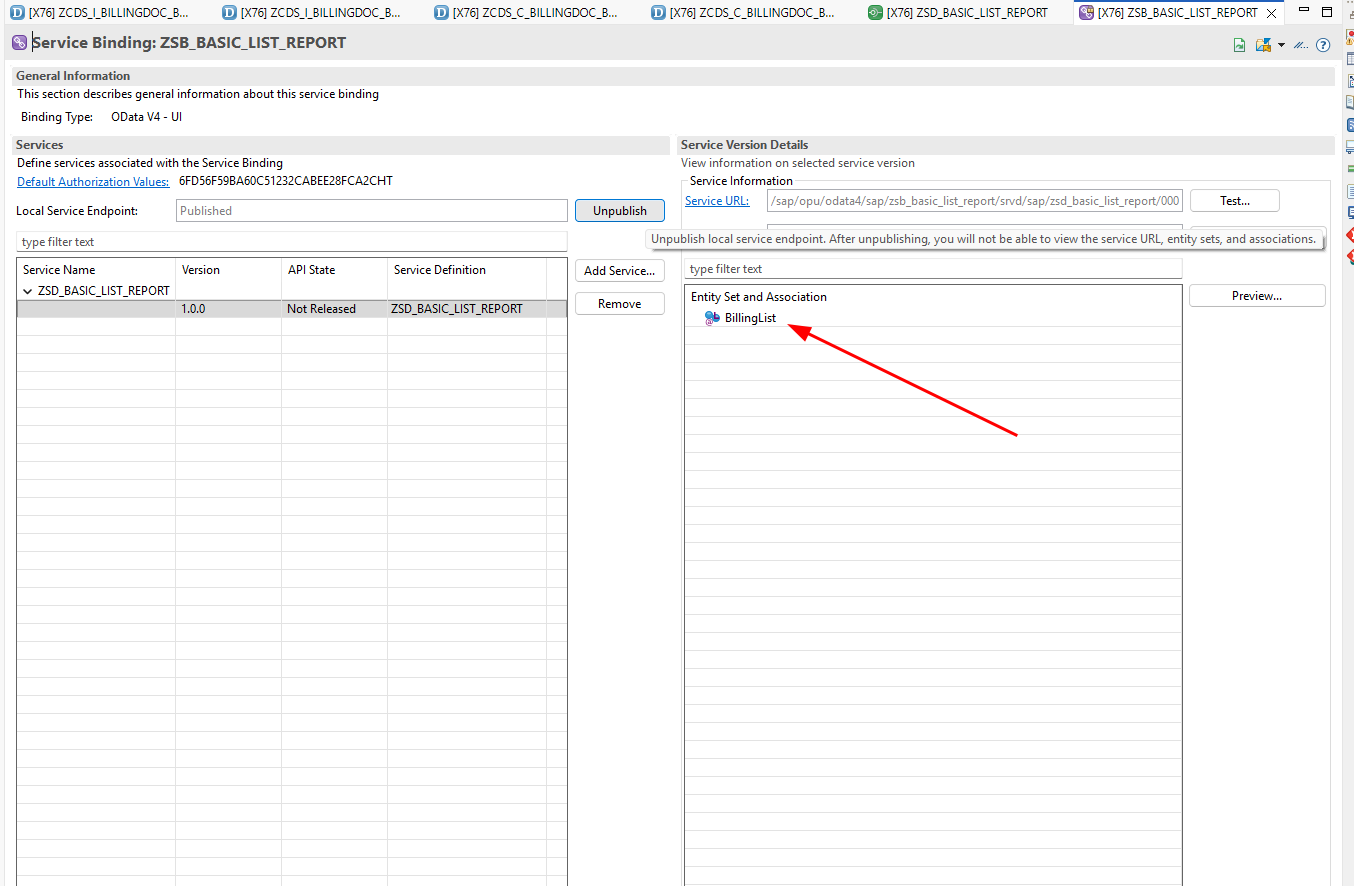
On the Service Binding page, first Activate the object. This action enables the Publish button.
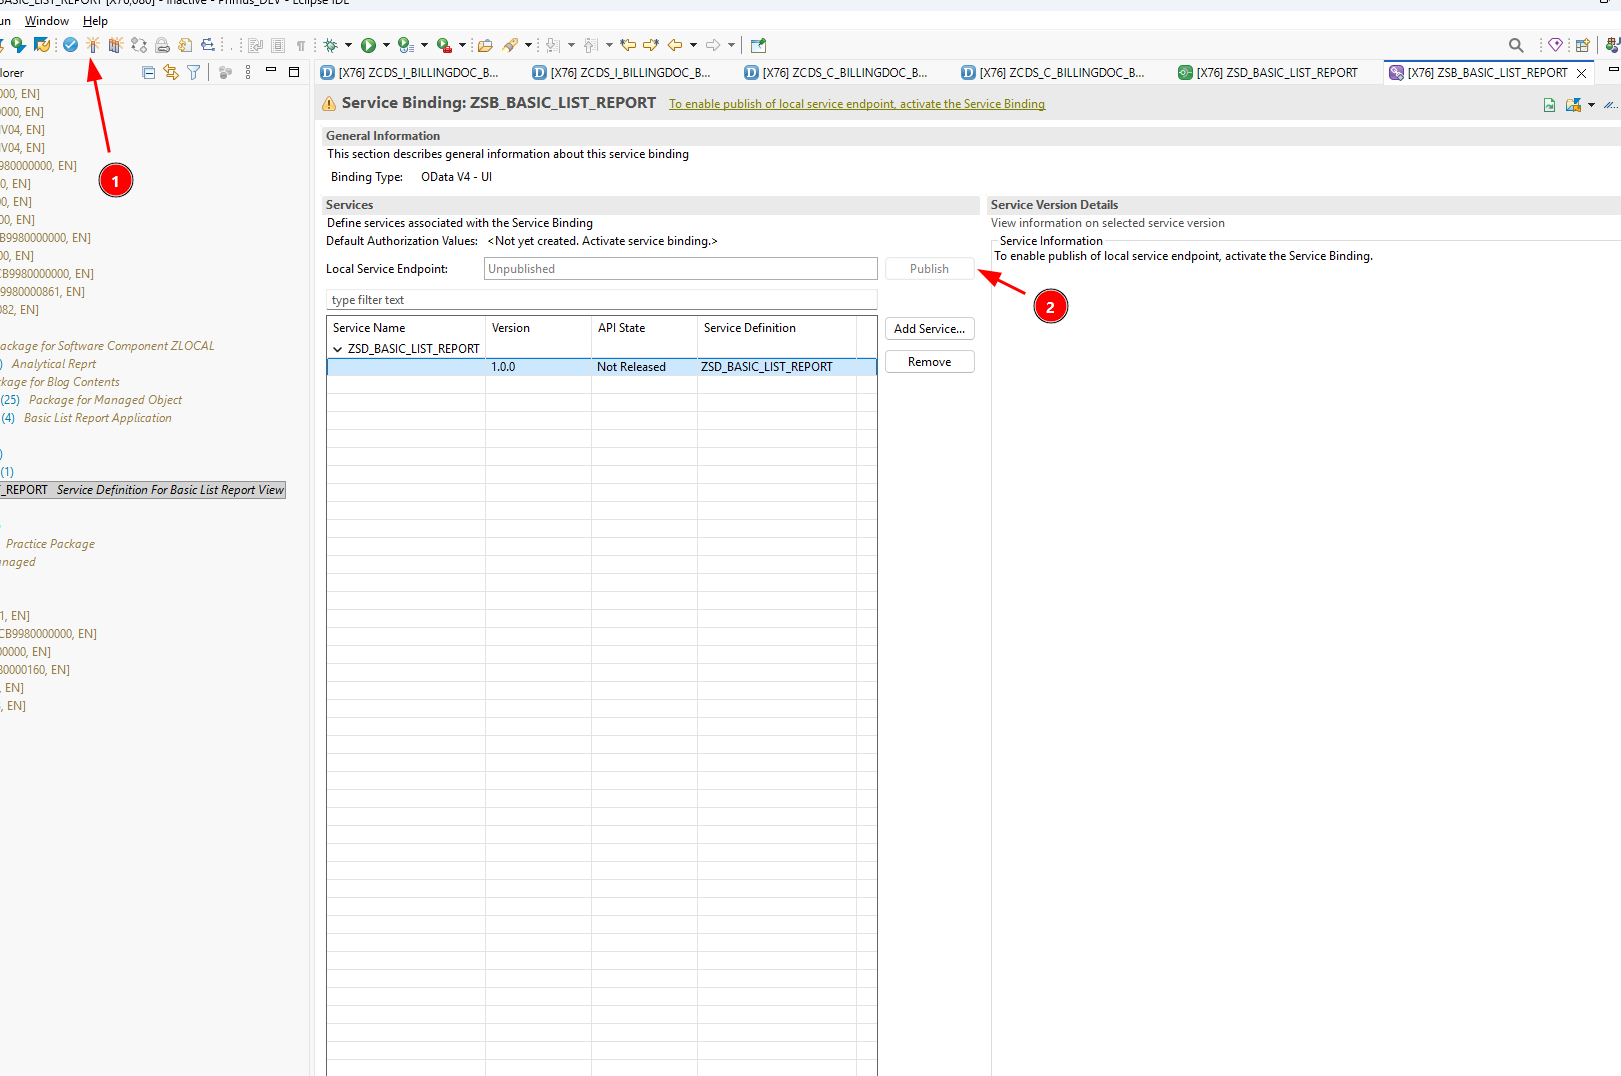
Once published, the entity set defined in the Service Definition will appear in the binding.
Step 7: Preview the List Report
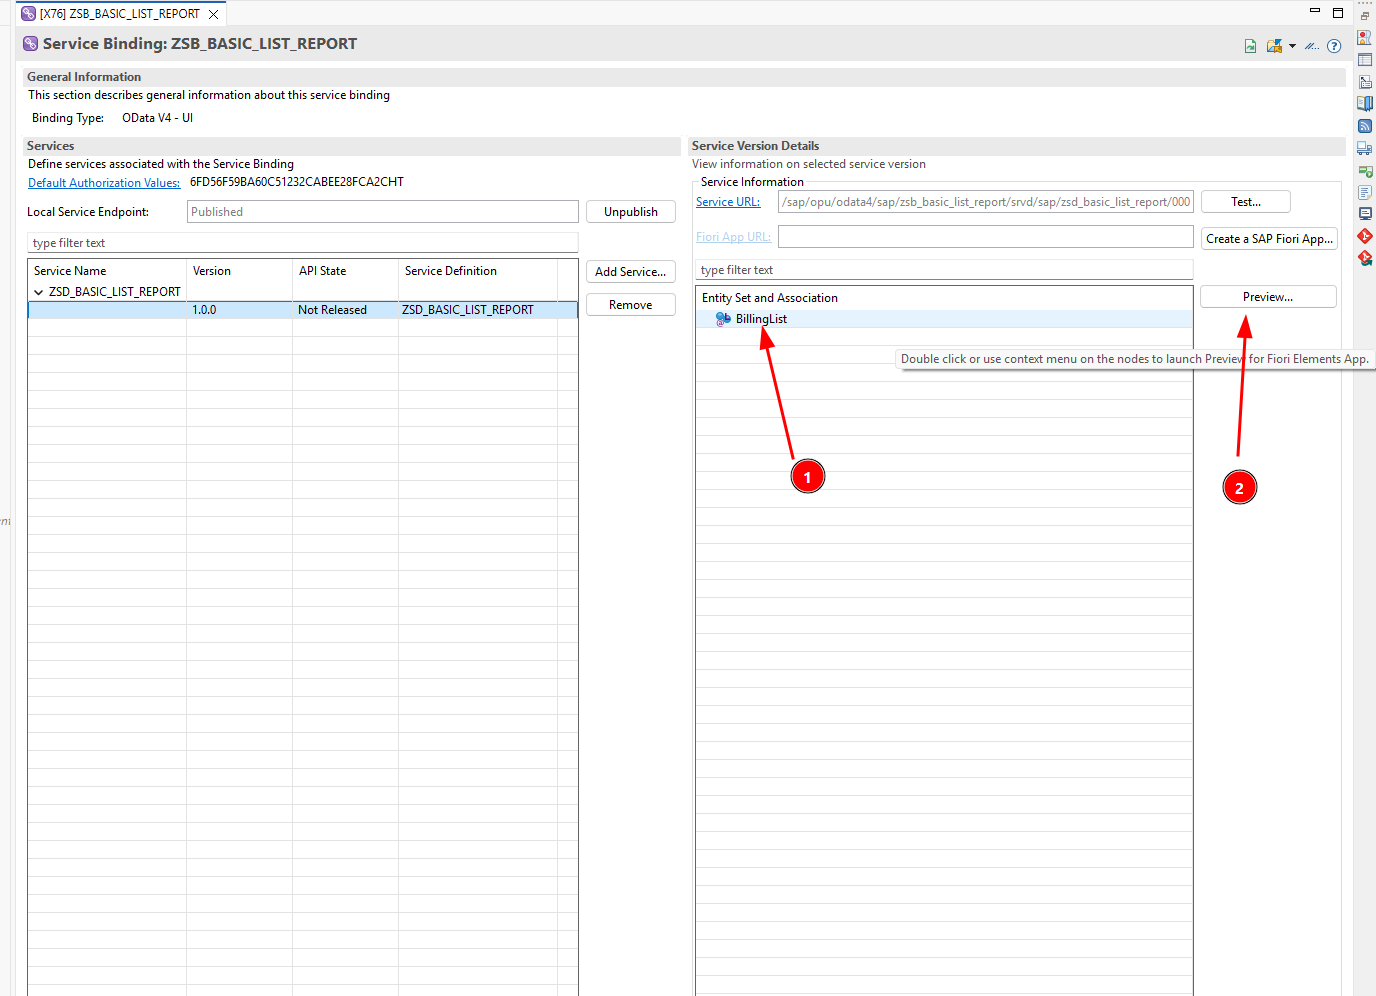
Switch to Client 100 and open the Service Binding.
Select the entity set and click Preview....
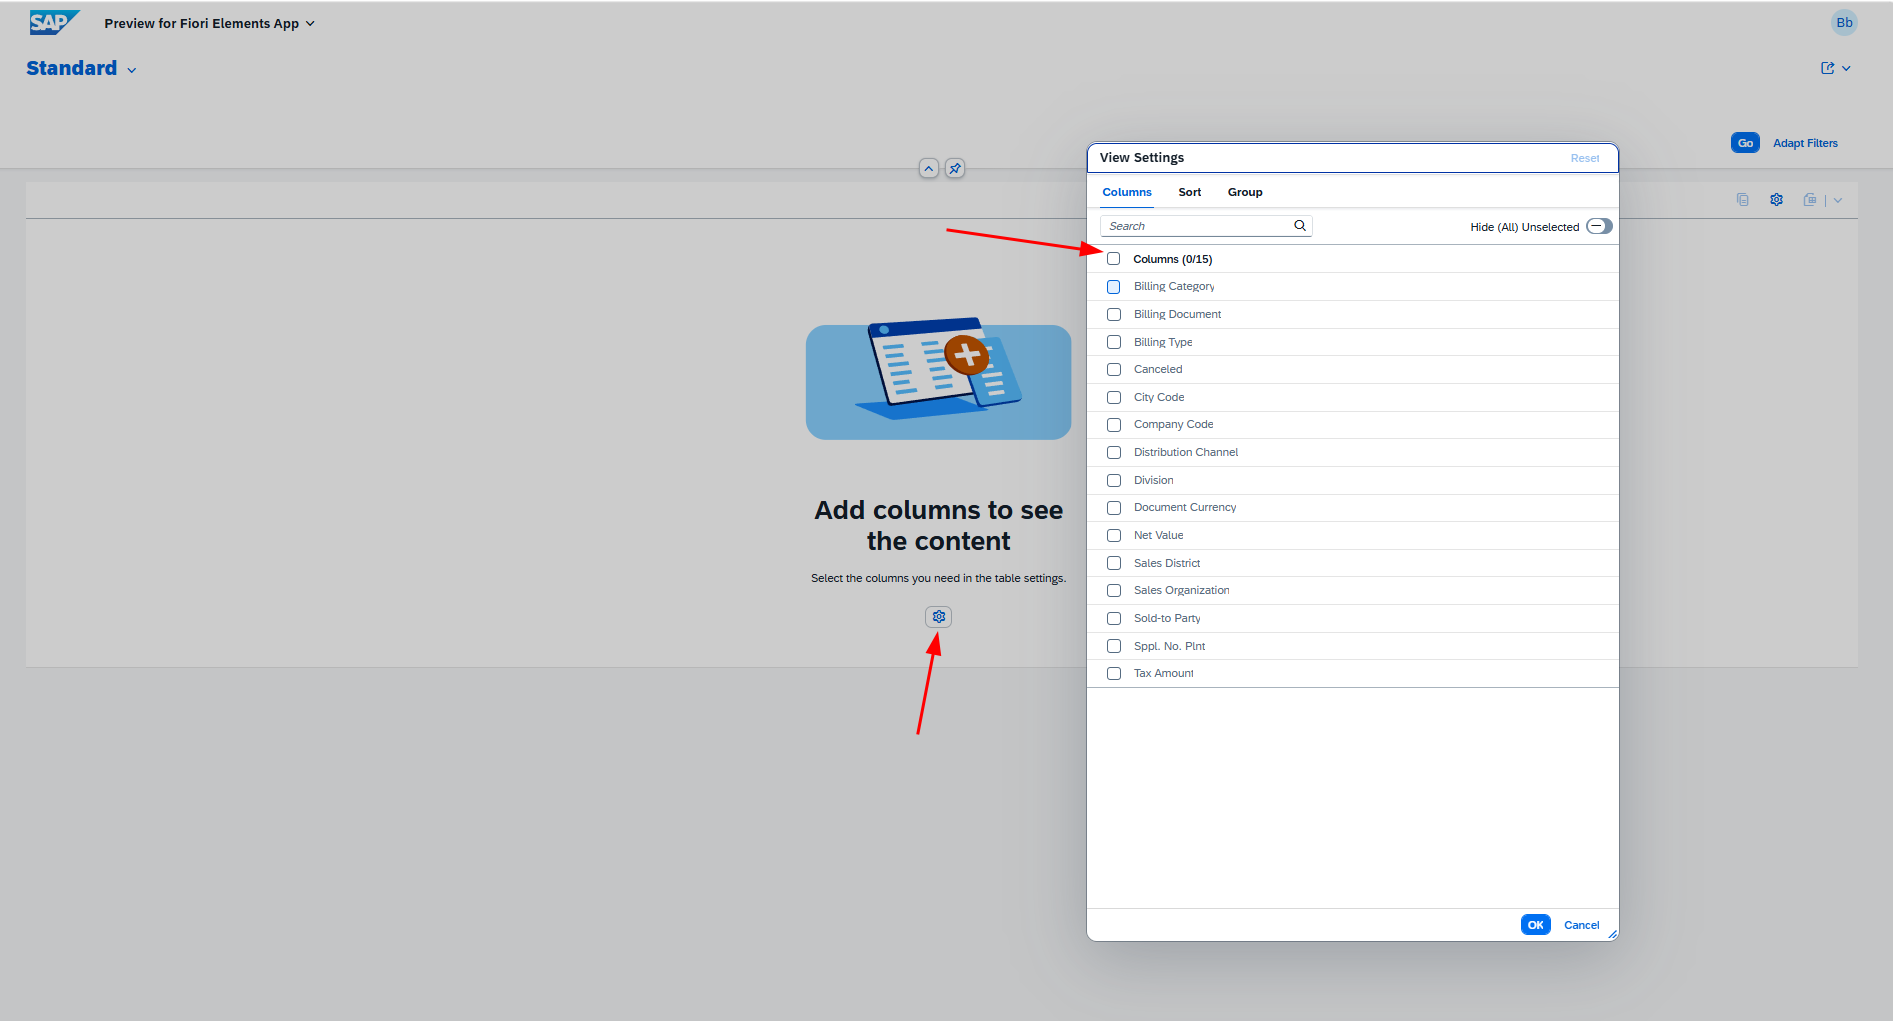
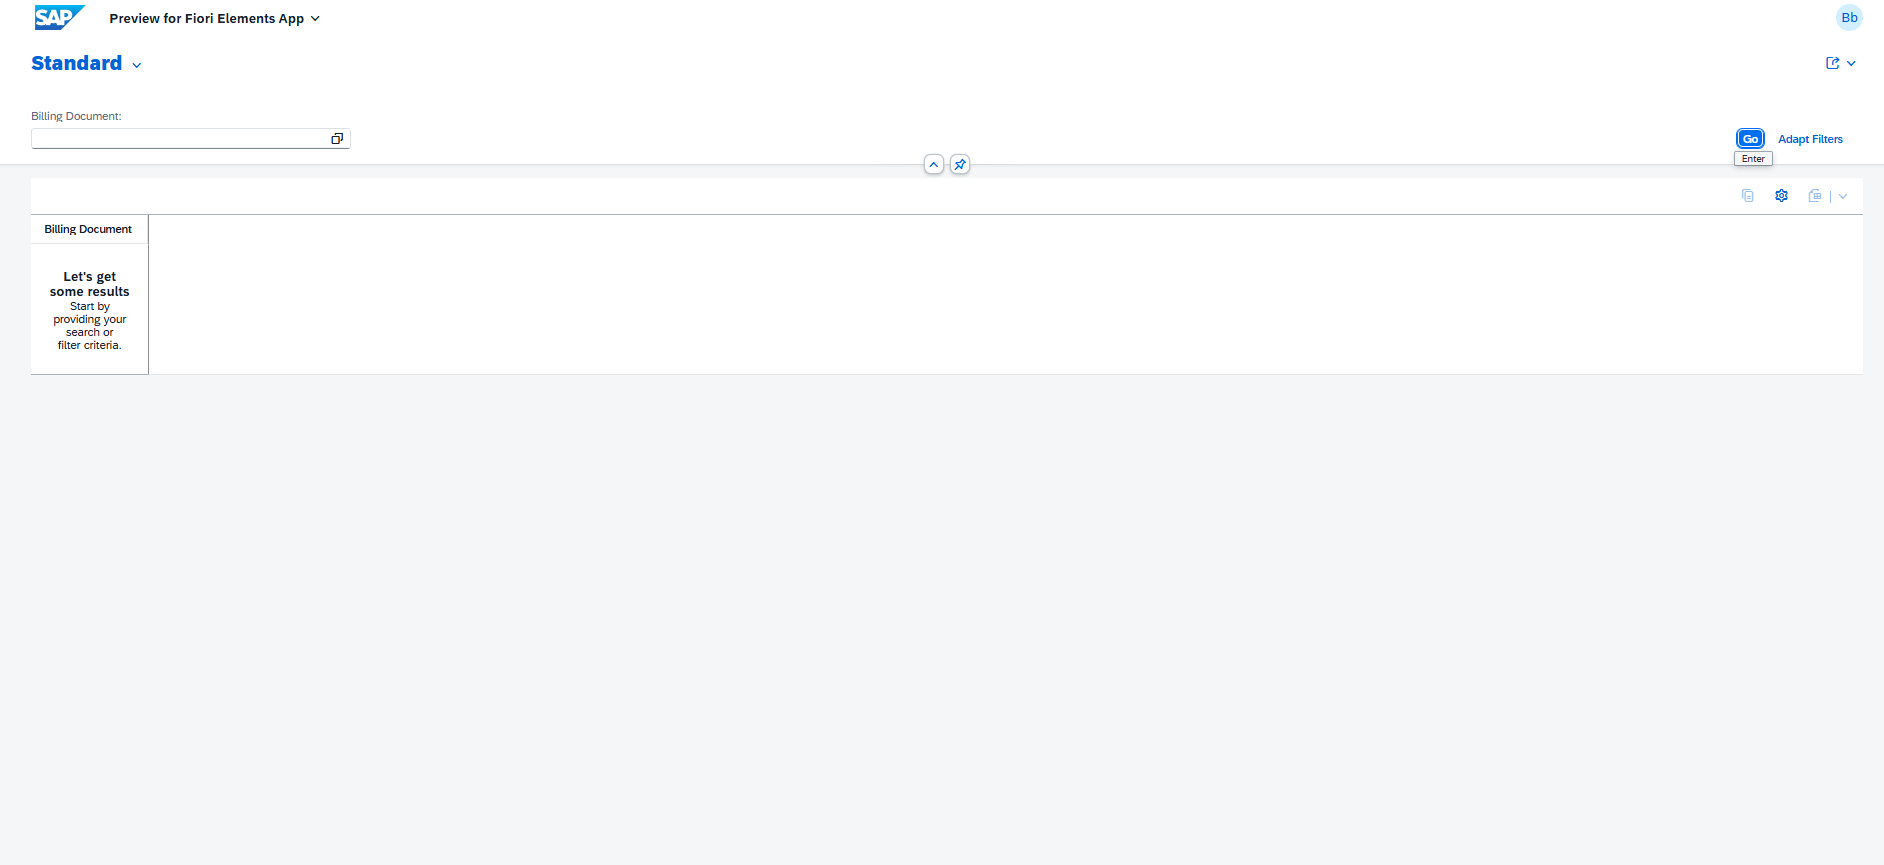
The initial preview will appear with no default columns selected and no visible filter fields — this is expected behavior at this stage.
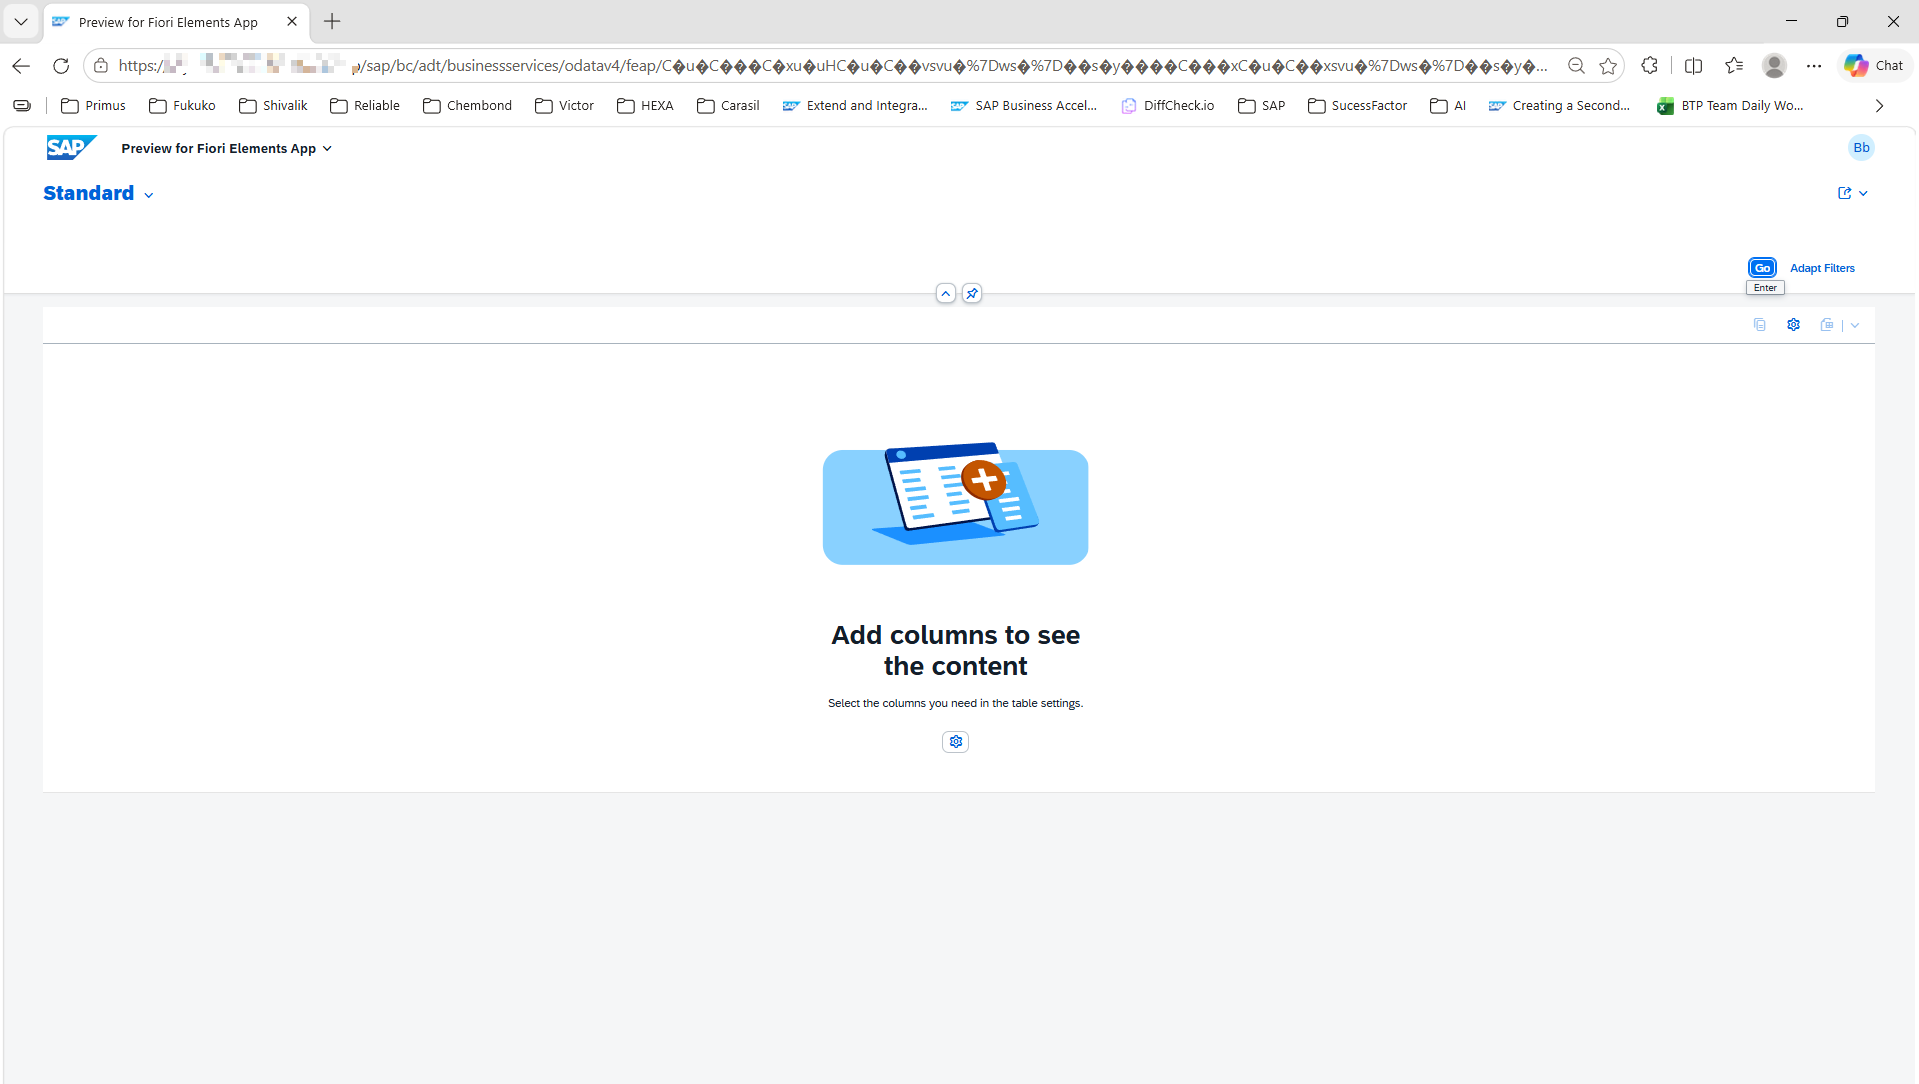
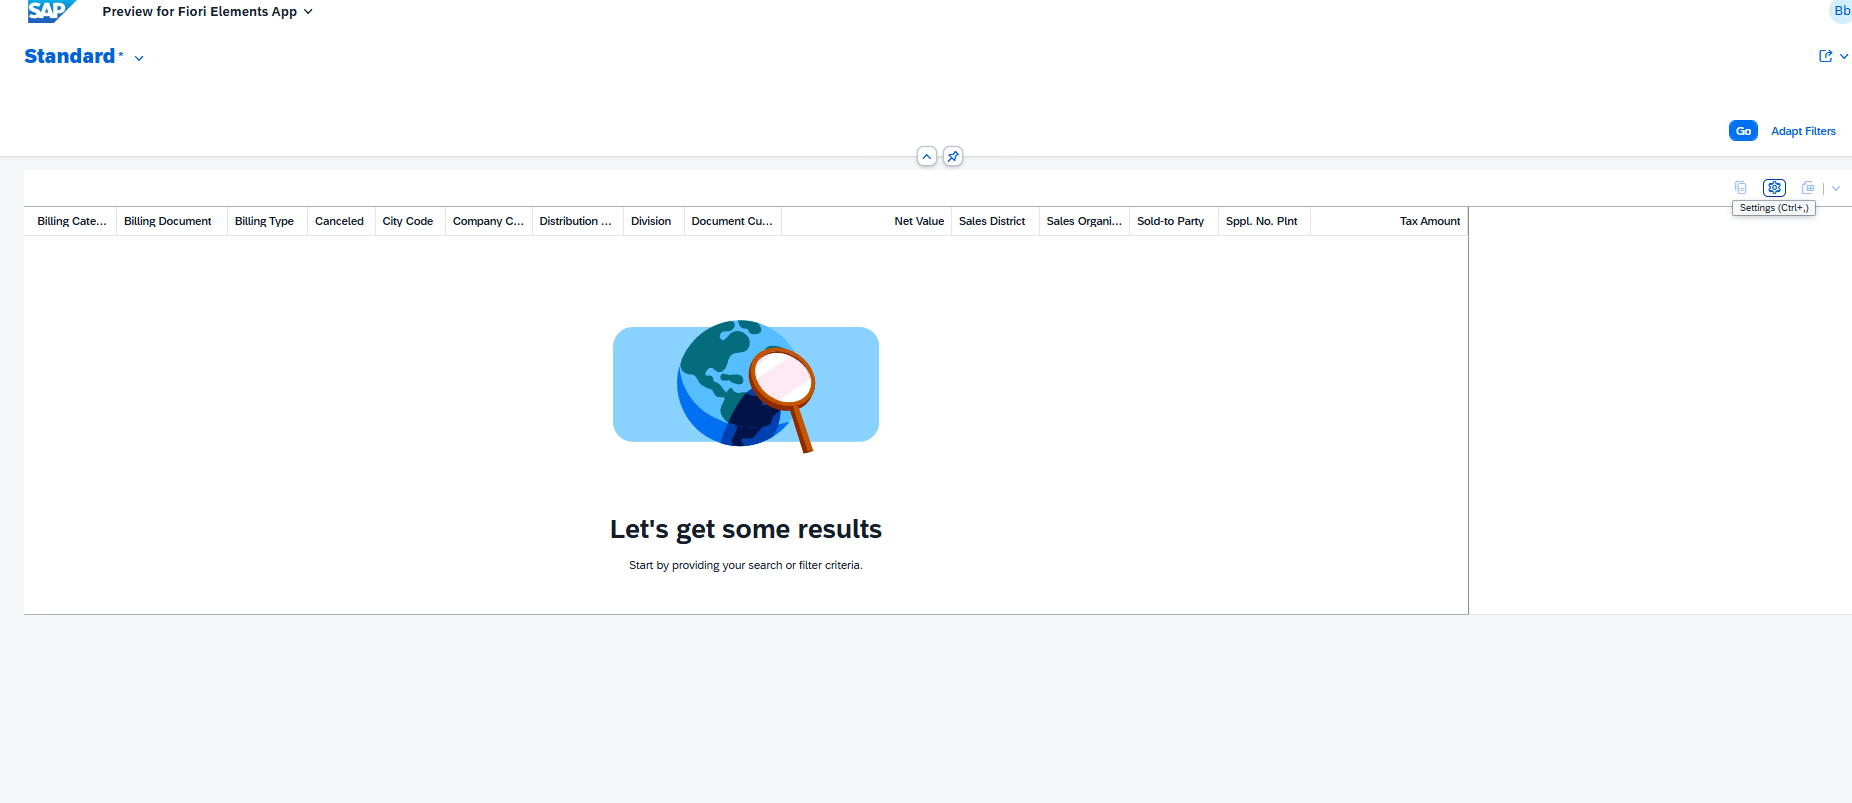
You can manually select columns to display.
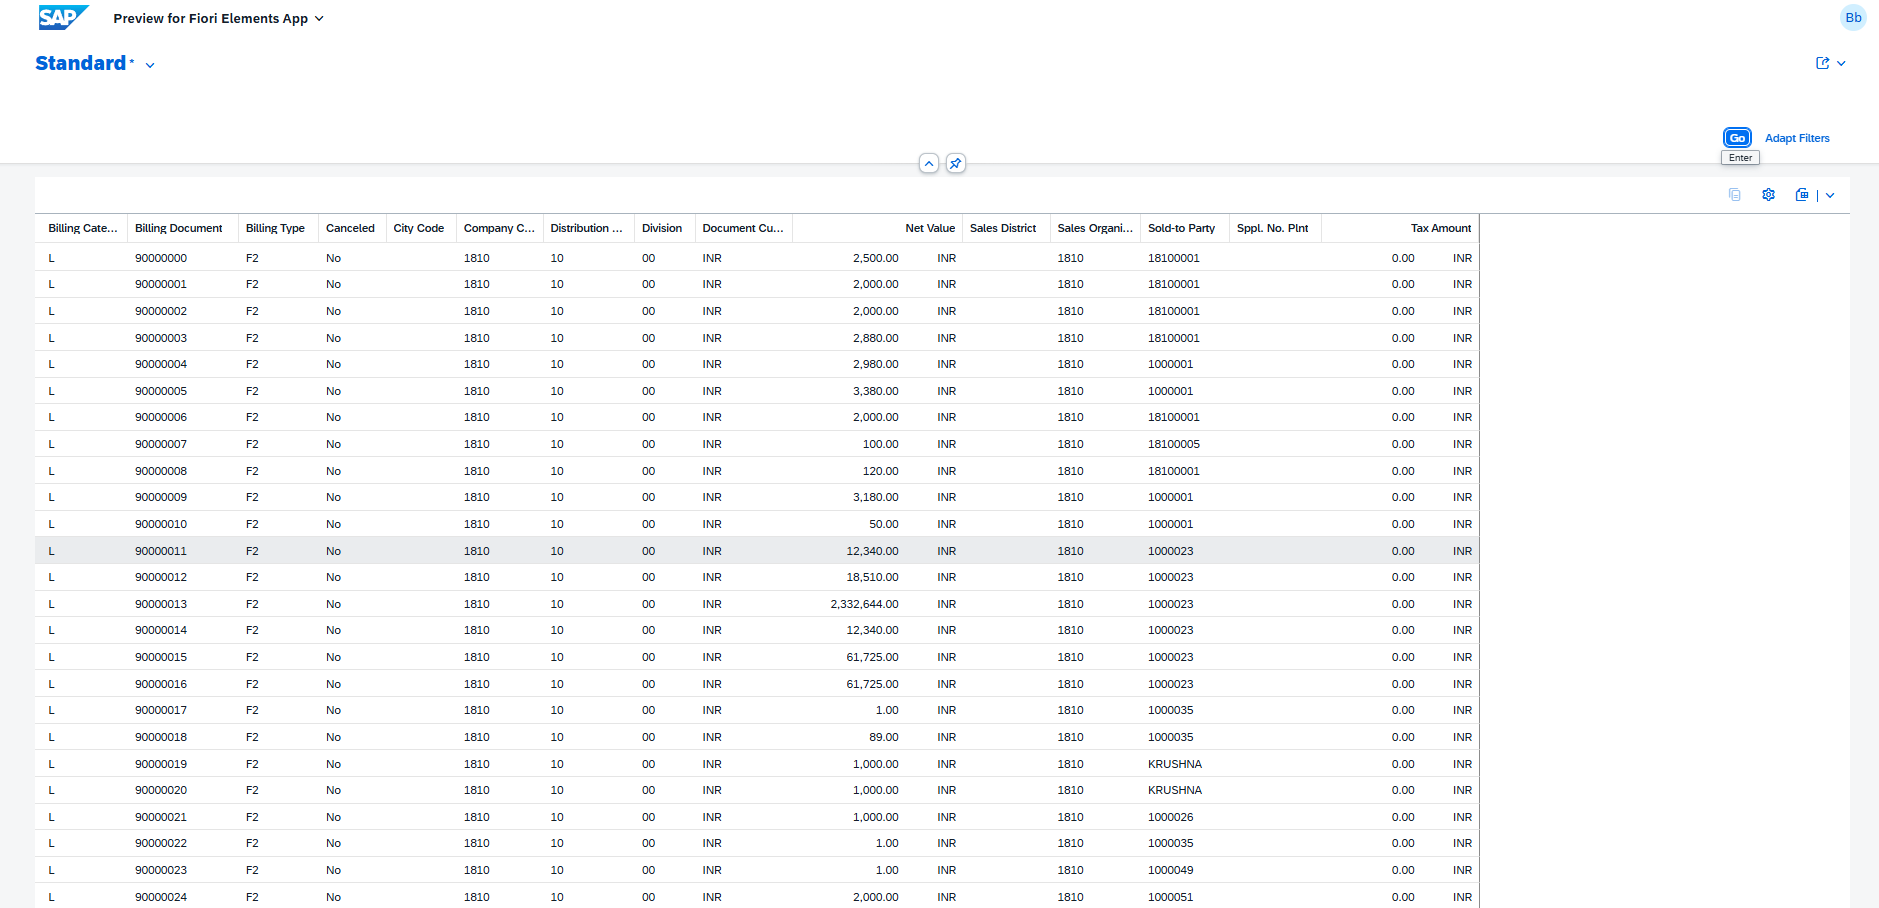
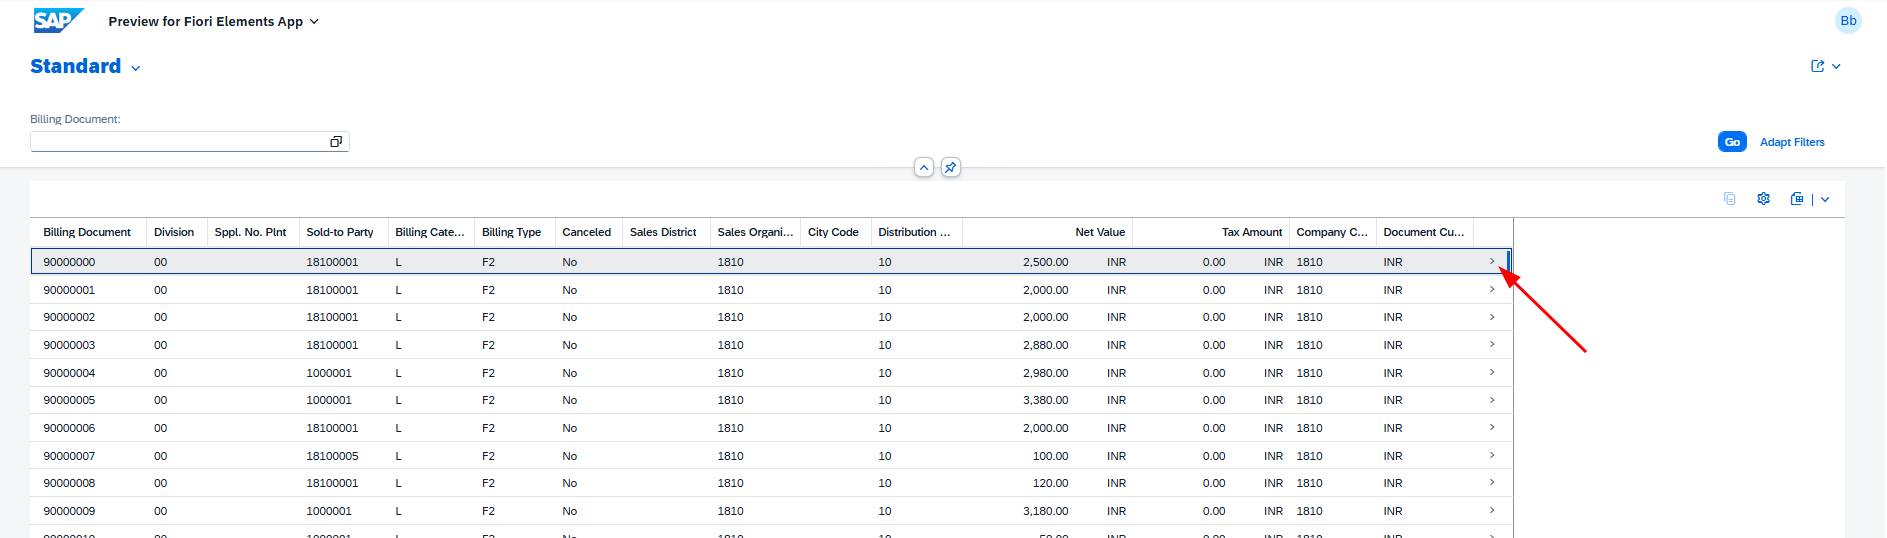
After selecting columns, press Go to load the data.
The data is now displayed successfully. However, there is a usability gap: columns must be re-selected after every page reload, and no default filter fields are visible. The next steps address both of these issues using CDS annotations.
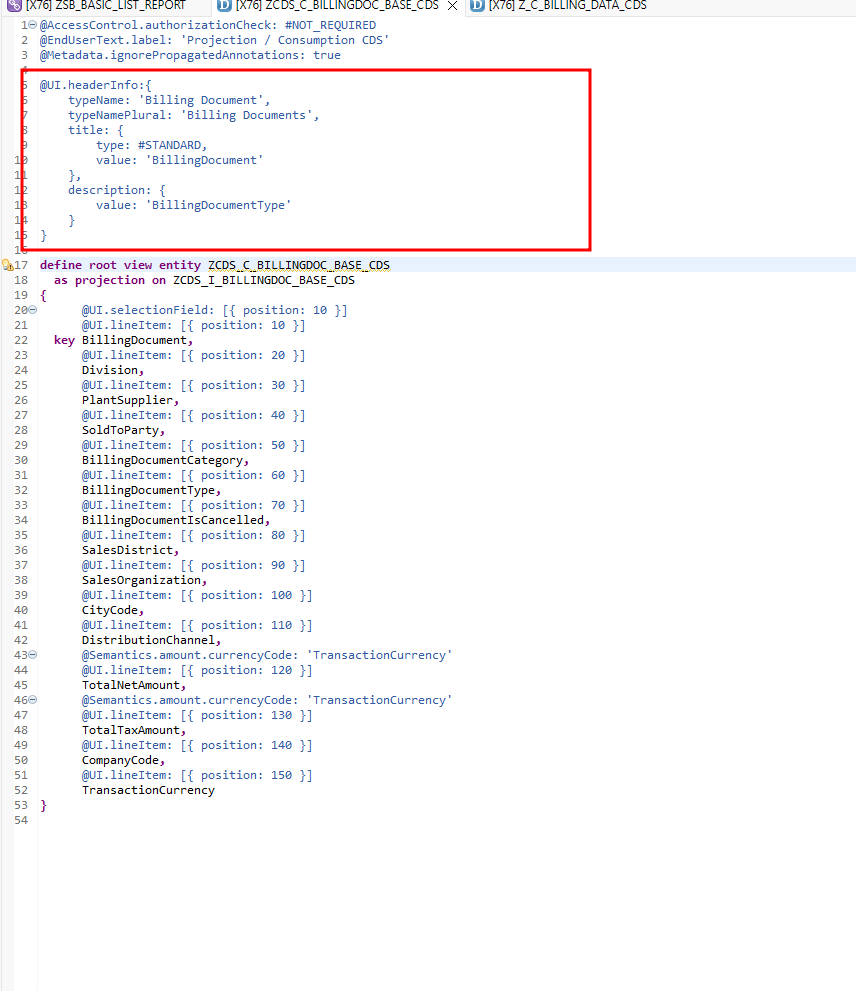
Step 8: Add Default Filters and Columns via Annotations
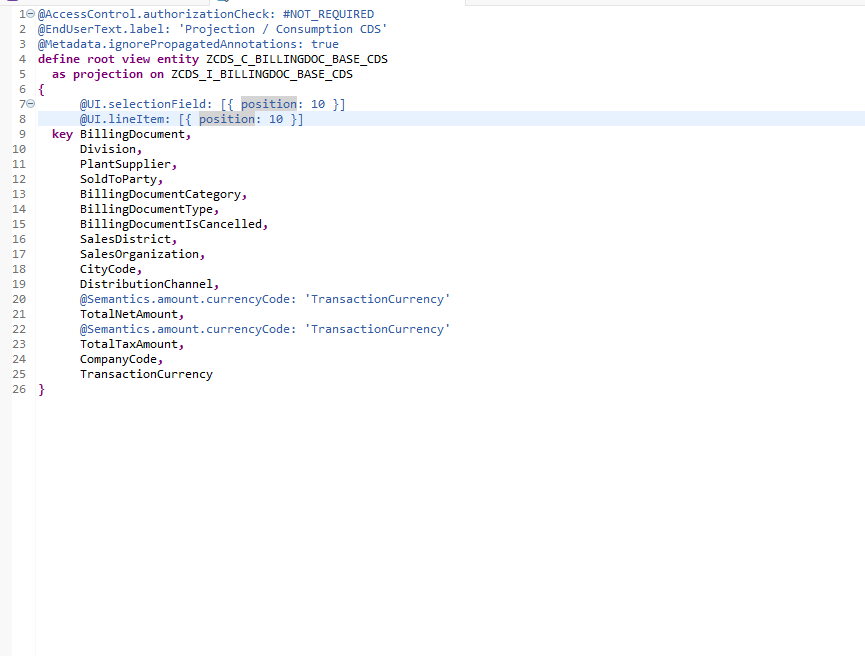
To define a default filter field, add the following annotation above the relevant field in your Projection View:
@UI.selectionField: [{ position: 10 }]
To define default visible columns in the list, add:
@UI.lineItem: [{ position: 10 }]
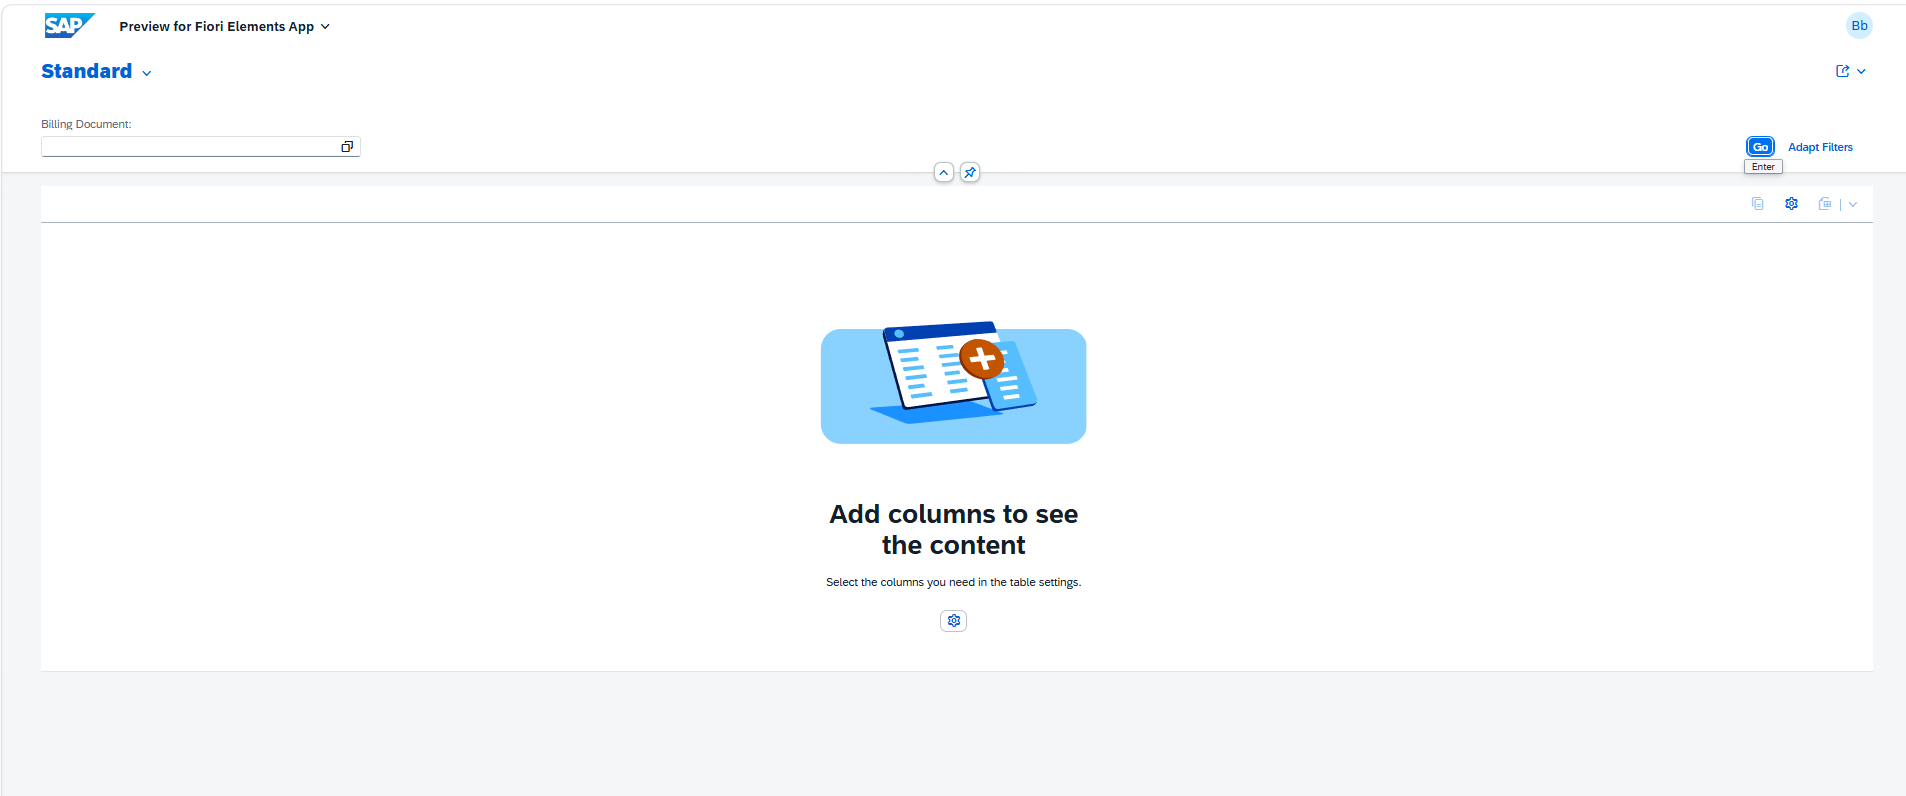
Apply both annotations to the BillingDocument field as a starting point.
On the next reload, the BillingDocument column appears by default without any manual selection.
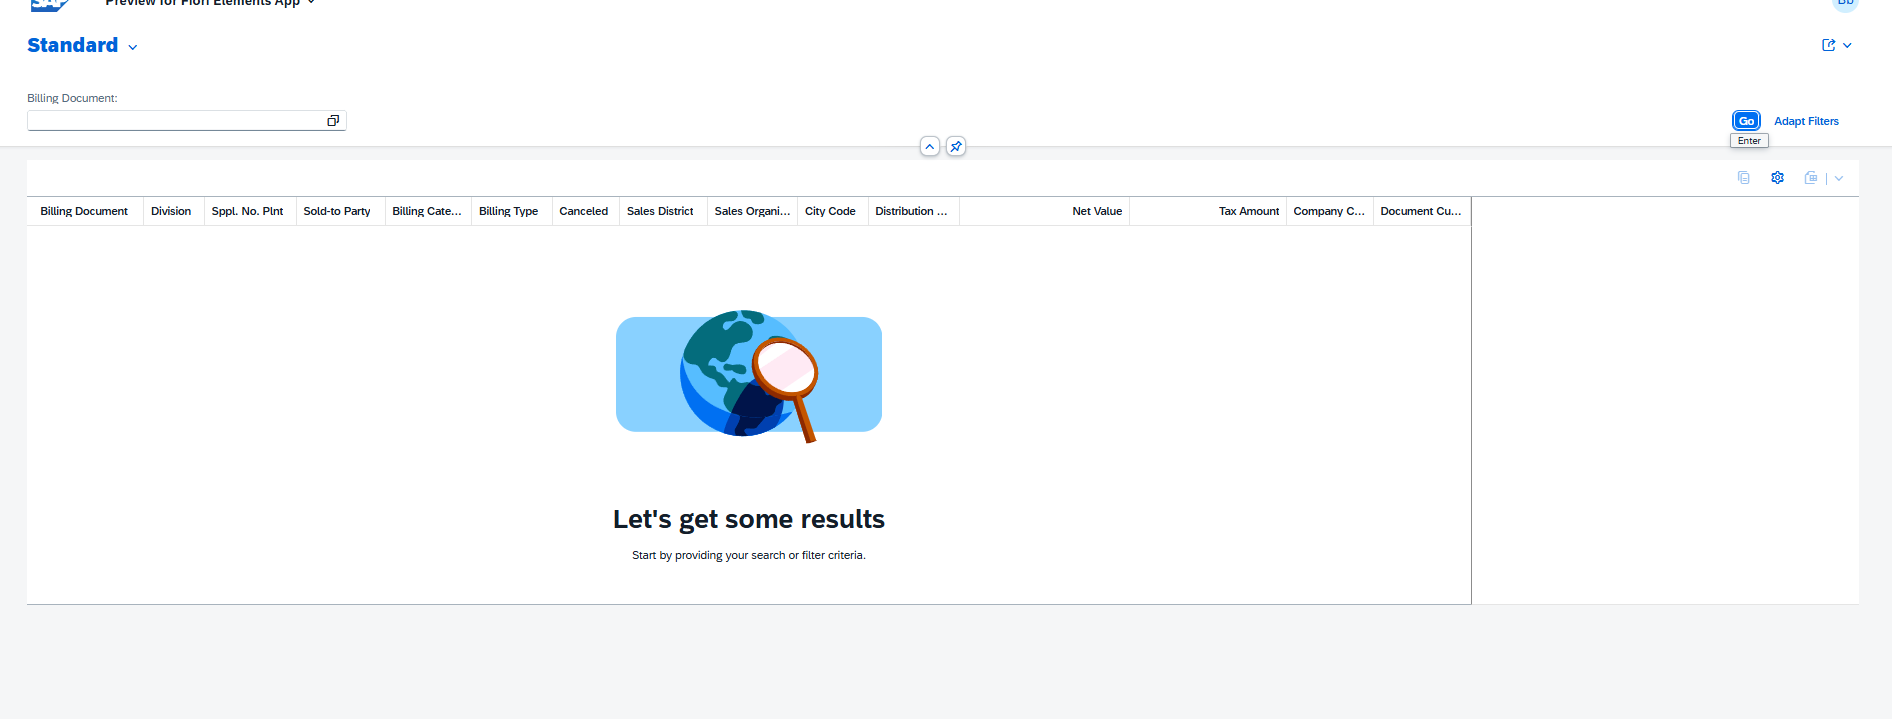
Continue applying both annotations to all remaining fields, adjusting the position value to control the display order.
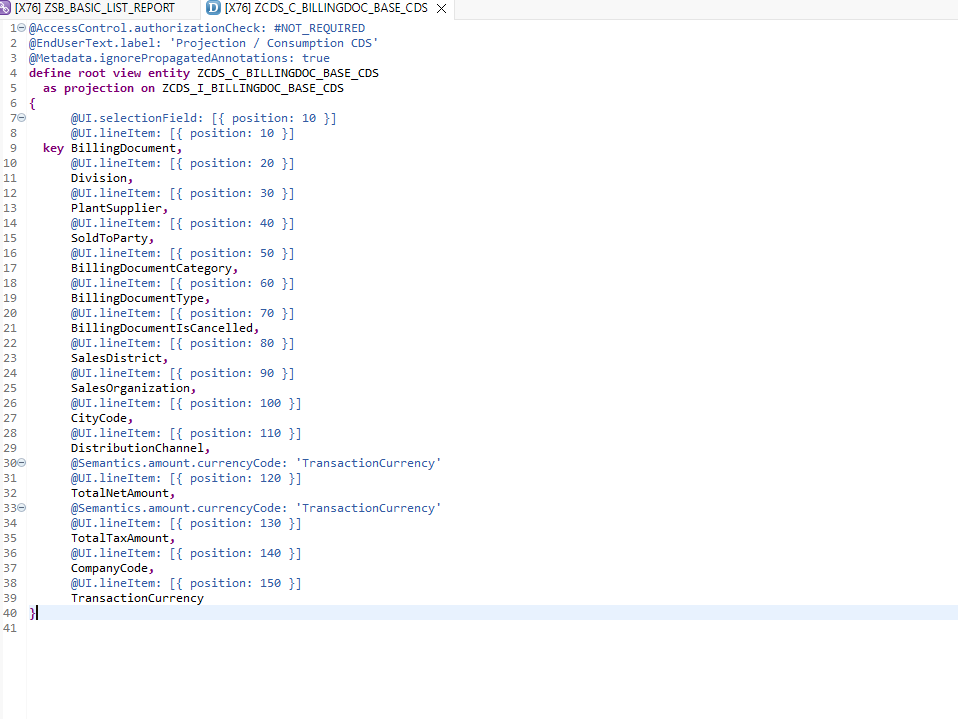
All configured columns now appear automatically on every page load.
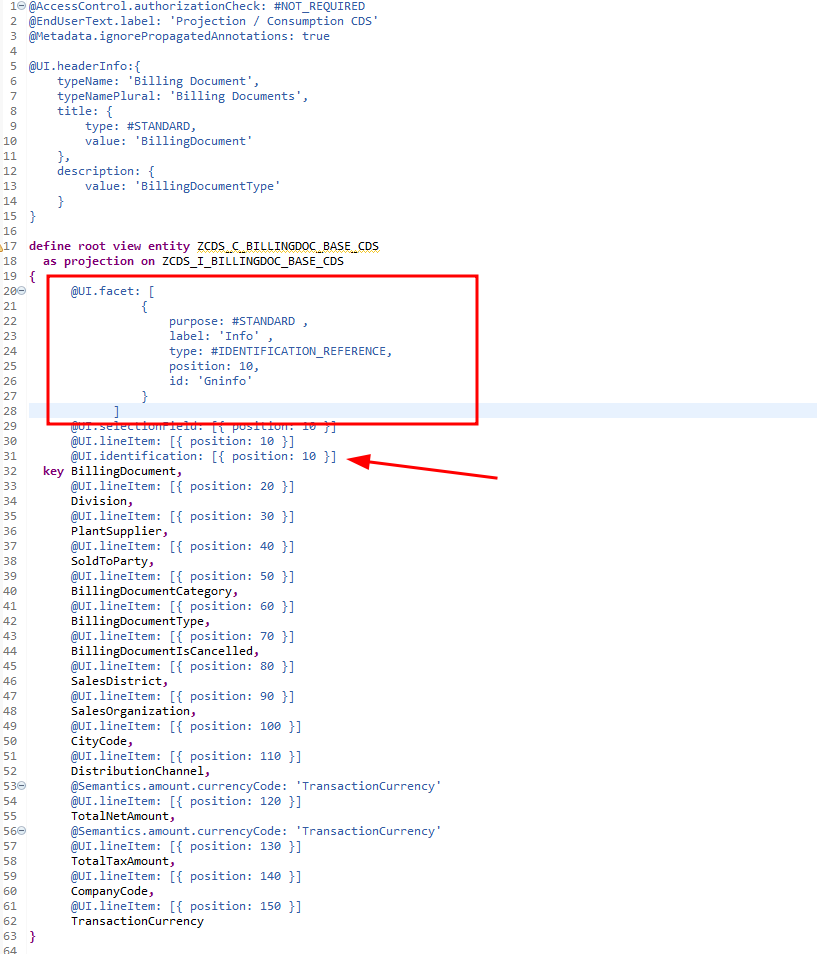
Step 9: Configure the Object Page
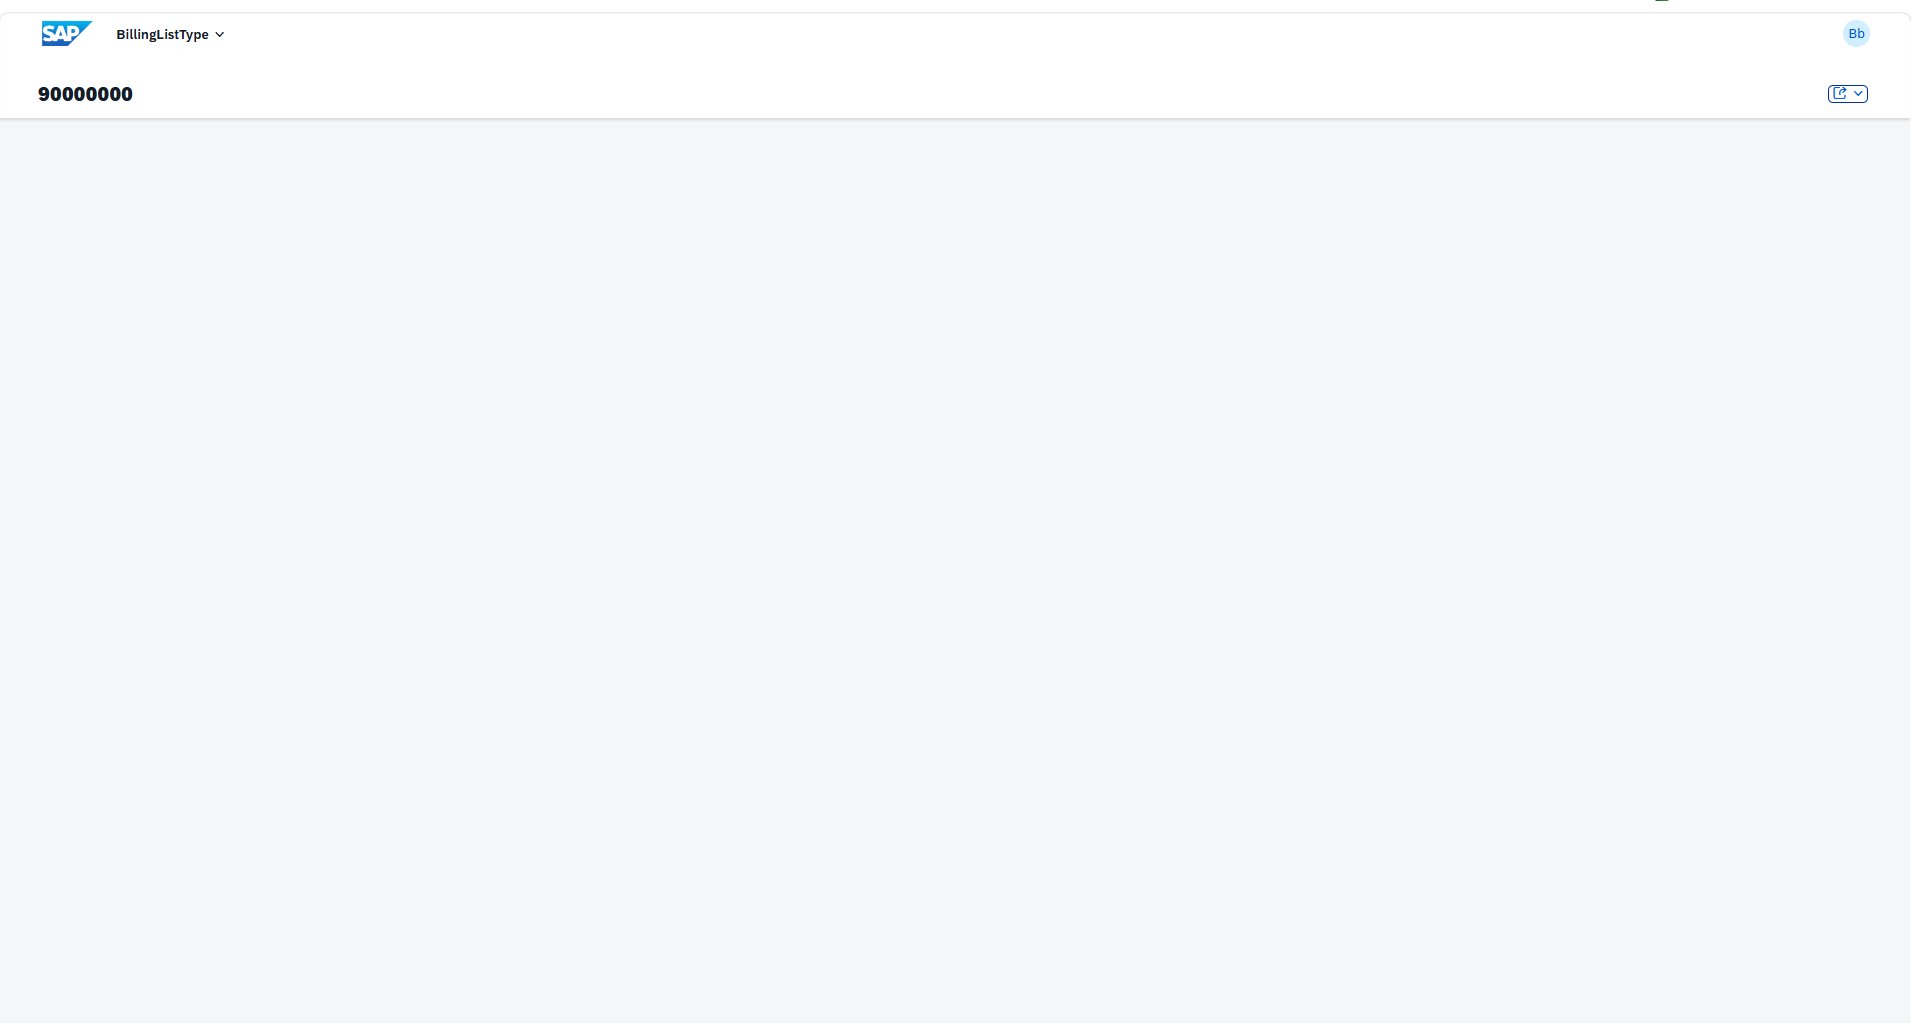
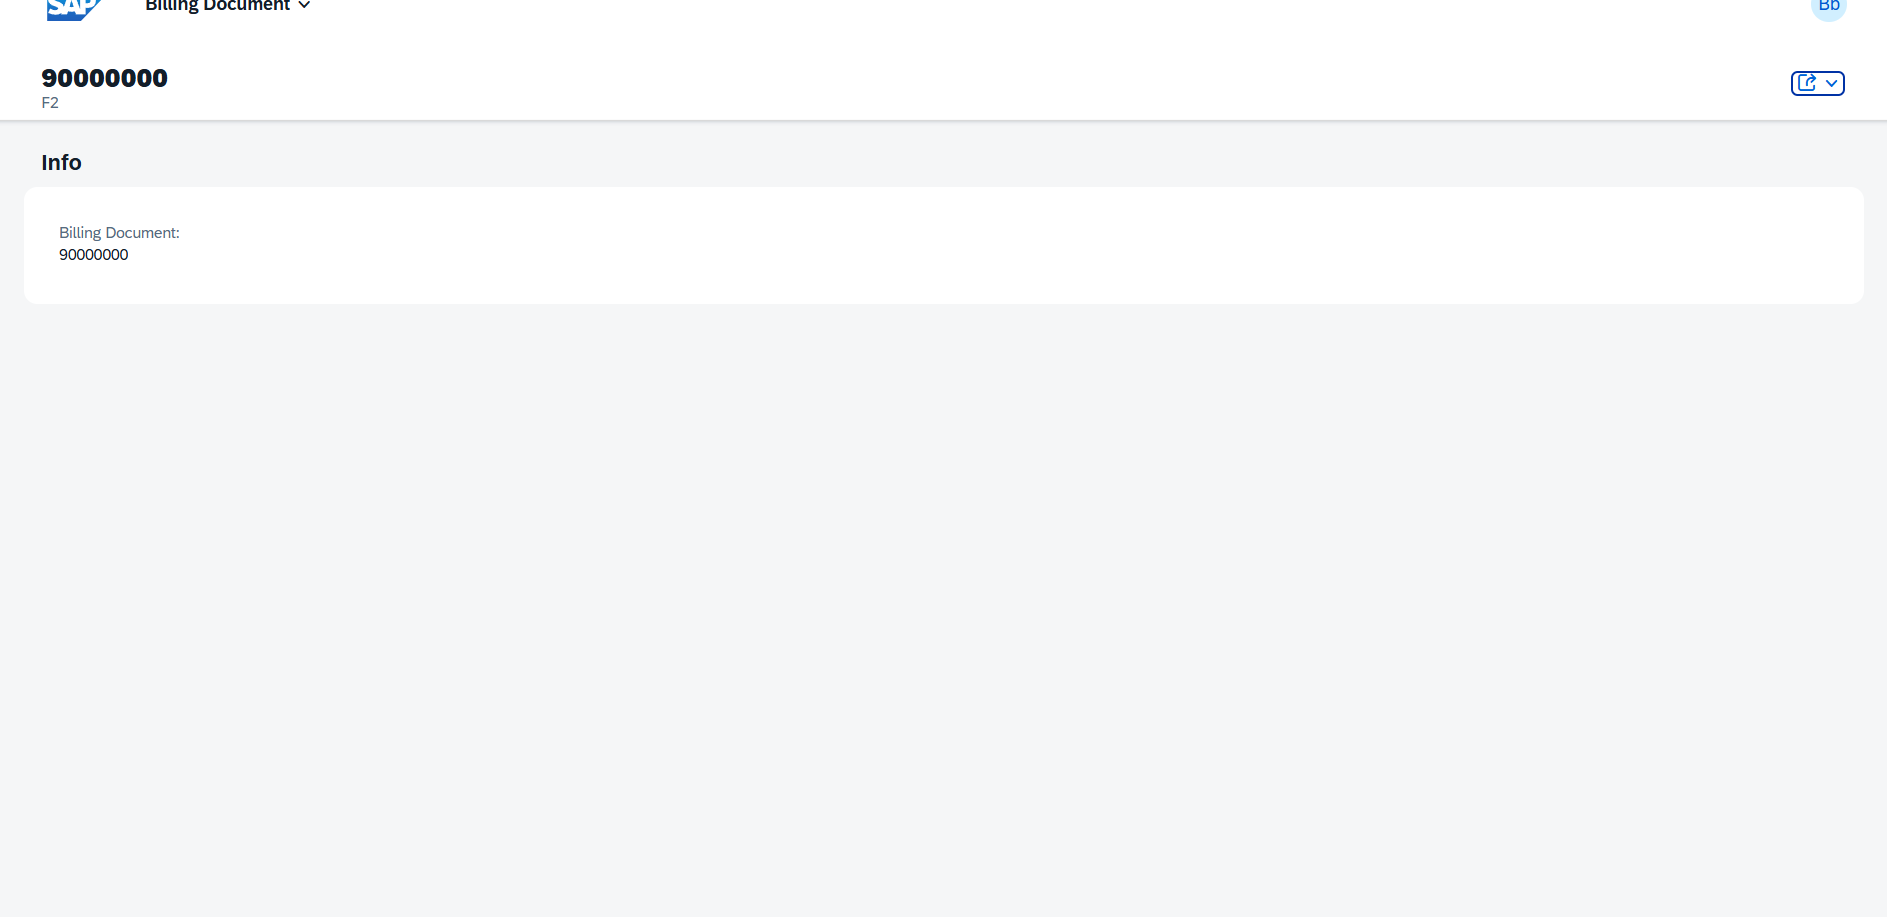
Selecting a row in the List Report navigates to the associated Object Page. At this point, the Object Page is empty, as no annotations have been defined for it yet.
The page is currently blank.
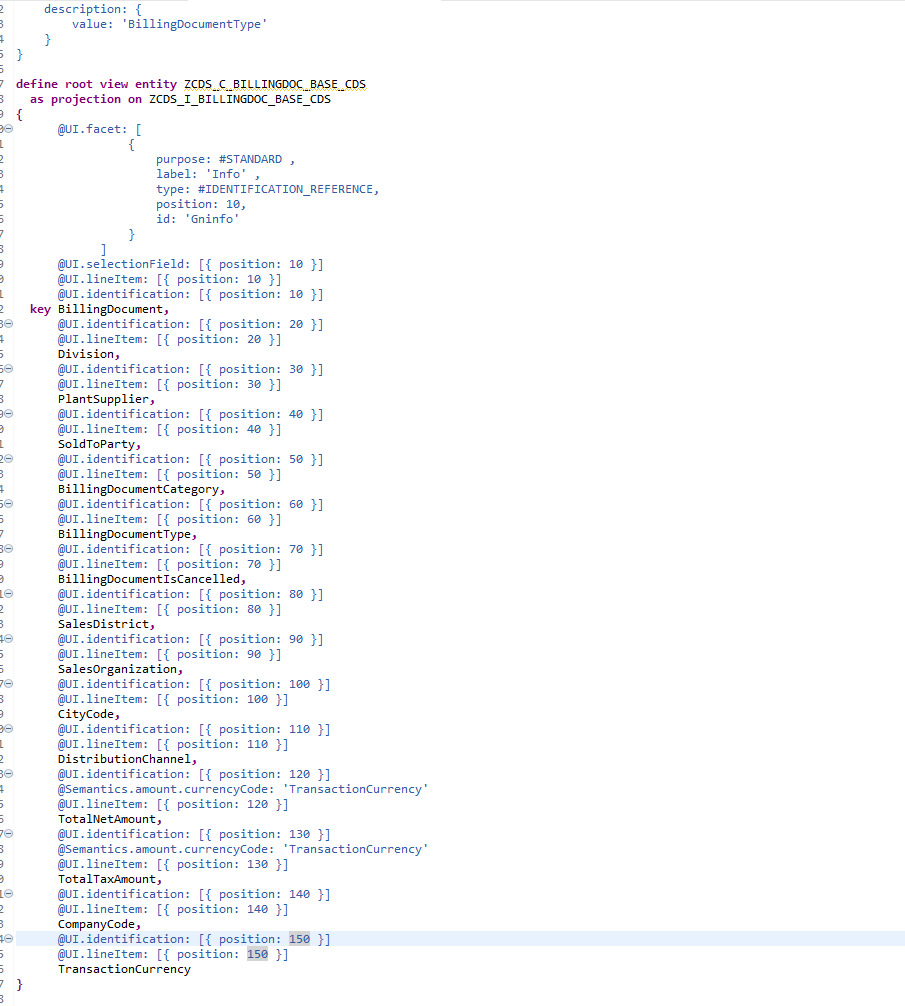
Start by defining a header for the Object Page. Use the BillingDocumentType field as the header title.
The header now renders correctly on the Object Page.

Next, add a field group (panel) to display the detailed record data.
Begin by adding one field to the panel to validate the setup.
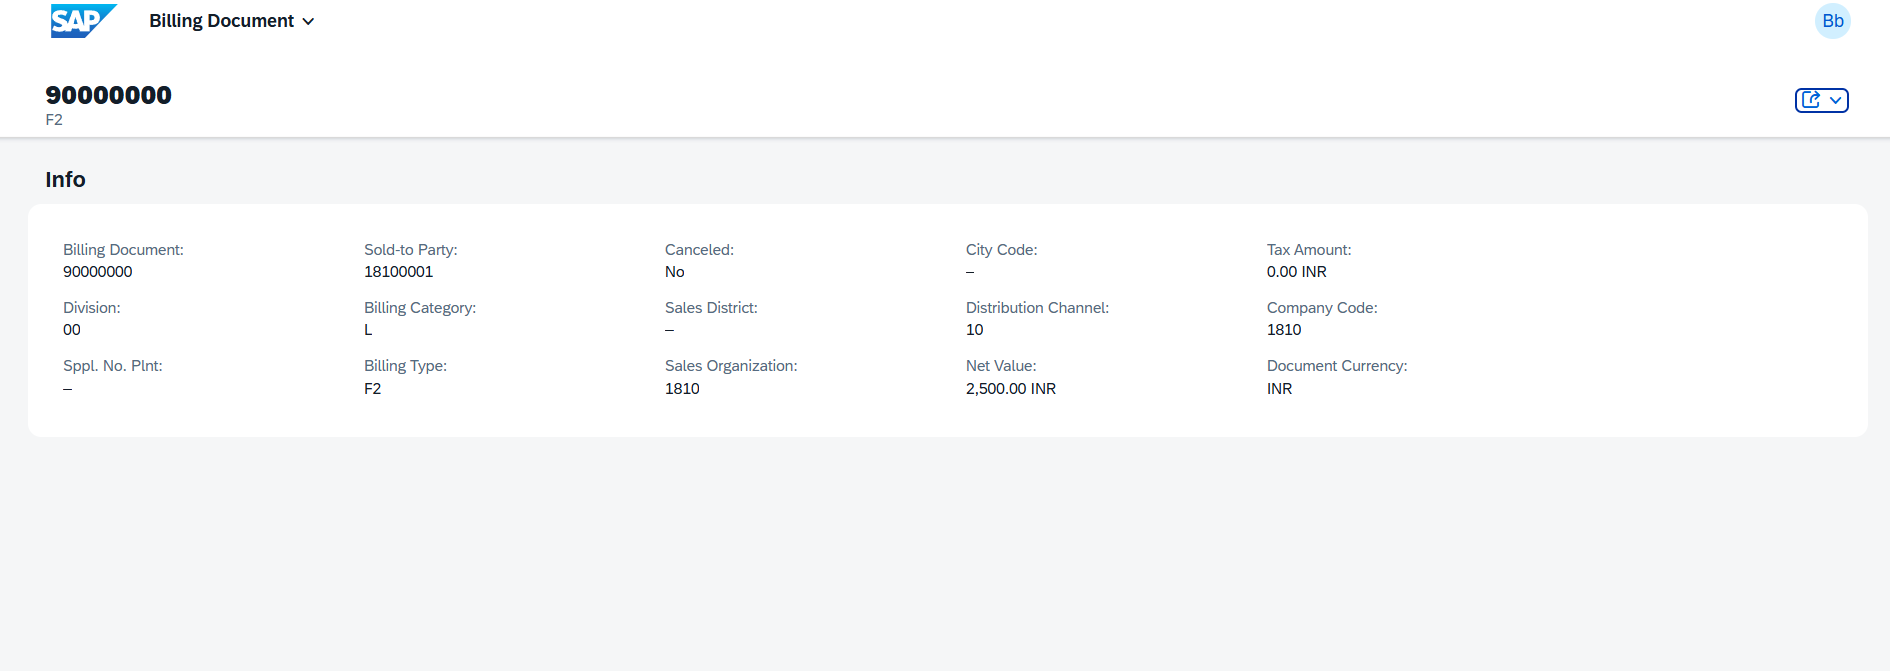
Continue adding the remaining fields to complete the Object Page layout.
The Object Page now displays all configured fields in a clean, structured layout.
Summary
In this tutorial, you built a fully functional SAP Fiori Elements List Report using the SAP RAP model in S/4HANA Public Cloud. Here is a recap of everything covered:
- Created a Development Package to organize all RAP artifacts.
- Built a Base (Interface) CDS View using
I_BillingDocumentas the data source, with proper semantic annotations for currency fields. - Resolved API contract errors by assigning the appropriate API State.
- Created a Projection (Consumption) View to expose the data model to the UI layer.
- Defined a Service Definition to register the projection view as an OData entity.
- Created and published a Service Binding using OData V4.
- Configured default filters and columns using
@UI.selectionFieldand@UI.lineItemannotations. - Enhanced the Object Page with a header and field group panels.
This foundation gives you everything you need to extend the application further — adding actions, associations, draft handling, or custom business logic using the full power of the SAP RAP framework.